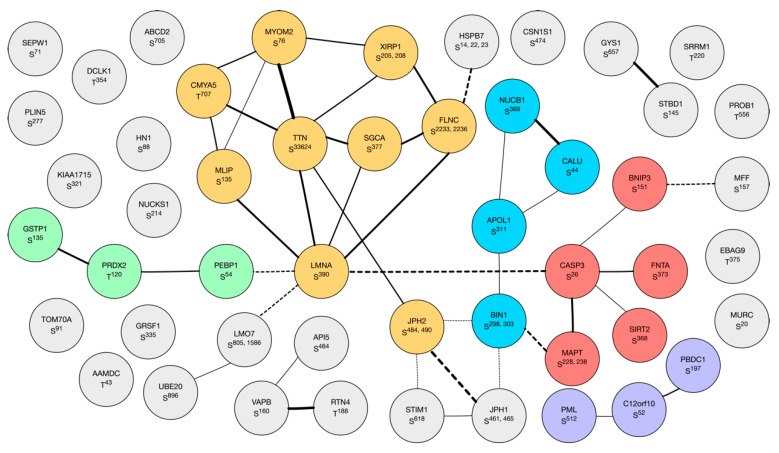
Figure 6.
Network of phosphorylated proteins. Network of known and predicted interactions between proteins (n = 141) with phosphopeptides that exhibited statistically significant (p < 0.05) differences in phosphorylation between morning and evening conditions. The network was constructed using the Search Tool for the Retrieval of Interacting Genes/Proteins (STRING), and subsets of proteins were highlighted by k-means clustering (6 groups). Node annotations represent gene names and phosphorylation sites. The width of the vectors indicate levels of evidence for protein interconnections (e.g., interaction, co-expression, or bibliometric data). Group 1 (orange) contains proteins associated with the myofibrillar apparatus and muscle cytoskeleton. Group 2 (red) is characterized by proteins involved in apoptosis (e.g., caspase 3, CASP3). Group 1 and 2 are interconnected by myc box-dependent-interacting protein 1 (BIN1; blue) which may be a key component of the muscle M-Band in addition to its role associated with t-tubules. Smaller groups are characterized by calcium-handling proteins (purple) or redox enzymes (green).

