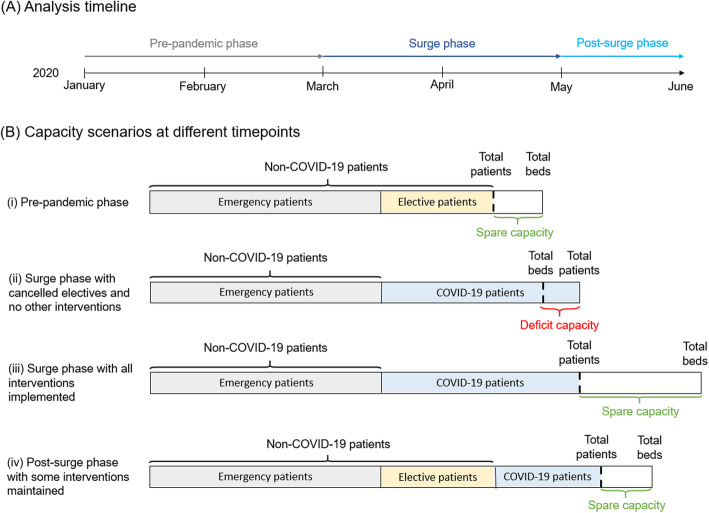
Fig. 1.
Schematic diagram of hospital capacity under different scenarios. a Timeline of the phases considered in the analysis. b Schematic illustration of bed capacity and occupancy partitioned non-COVID-19 and COVID-19 patients, and how this leads to either spare or deficit capacity, depending on the total number of beds available in the different phases and intervention scenarios. This is not drawn to scale. (i) Pre-pandemic phase, during which baseline bed capacity is defined as total beds, and baseline patient occupancy is defined as the number of these beds occupied, in the absence of hospital provision interventions and COVID-19 patients. (i) In the surge phase (ii and iii), all elective surgery was assumed to be cancelled, freeing up beds for COVID-19 patients. However, in (ii), this alone did not provide sufficient beds for all patients and thus there is deficit capacity. Other hospital provision interventions were used to increase the total number of beds in (iii) so that there was even spare capacity of beds. In the post-surge phase (iv), reductions in numbers of COVID-19 patients enables some elective surgery to resume, with the numbers of such patients who can be accommodated depending on the extent to which other interventions are maintained

