Figure 4.
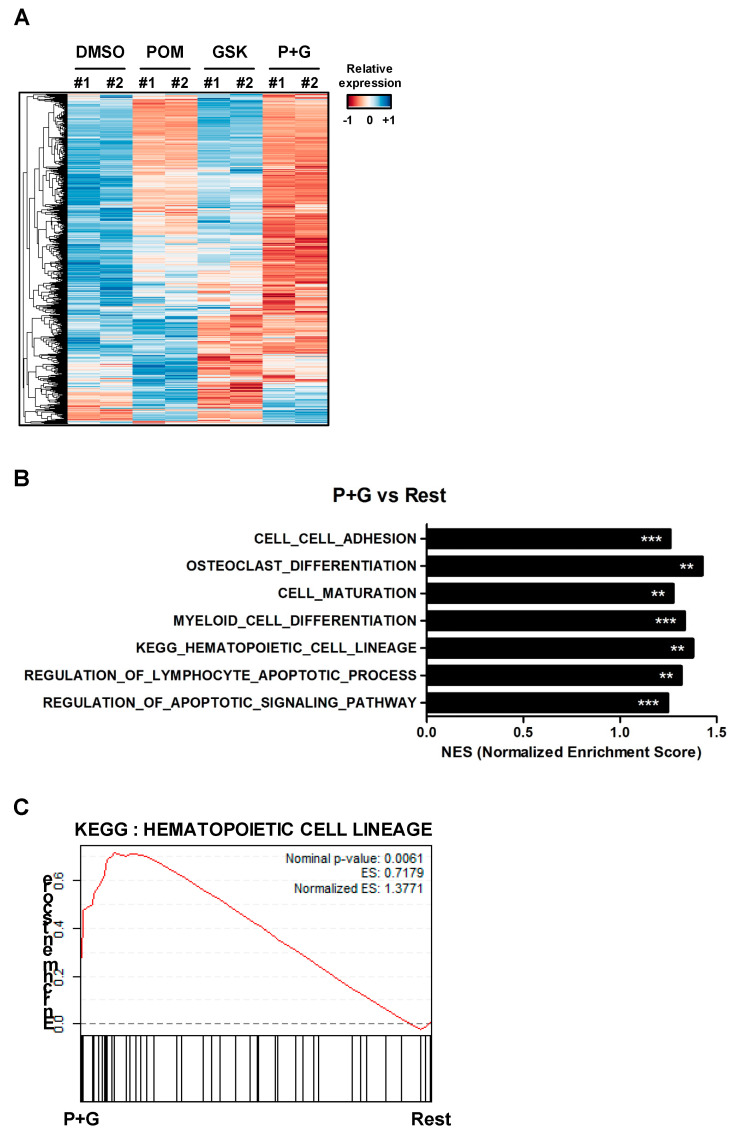
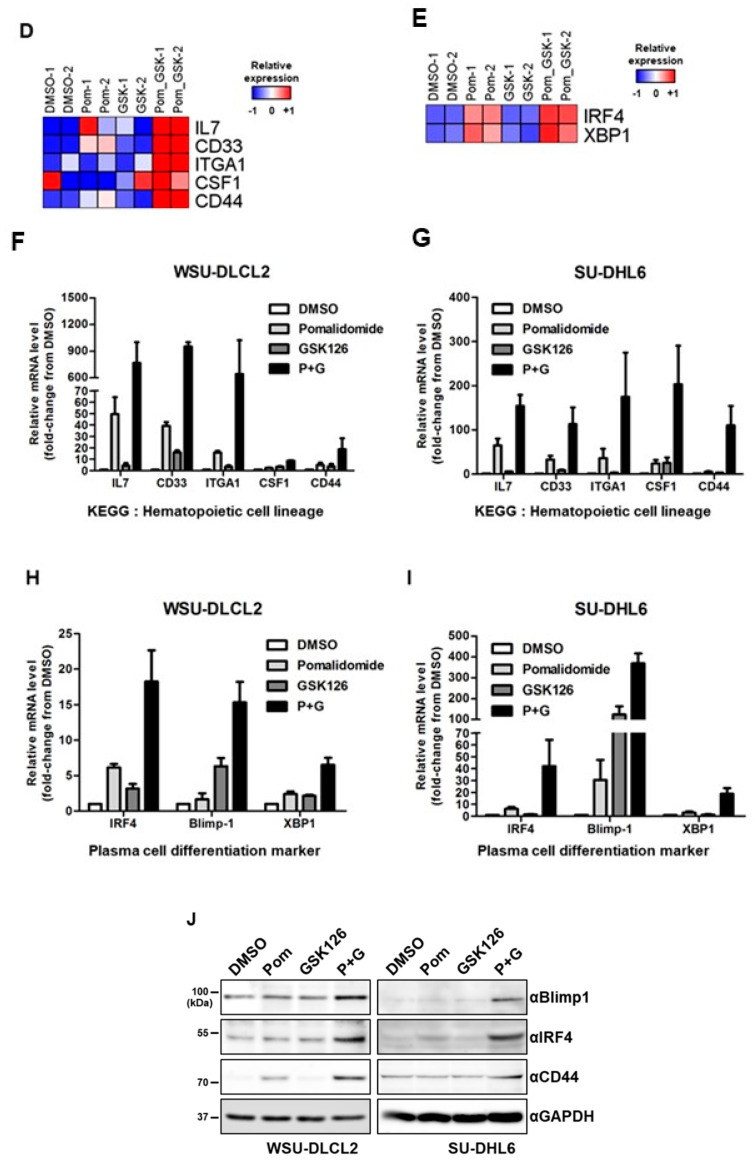
Combination treatment with GSK126 and pomalidomide changes cell plasticity and regulates hematopoietic cell lineage. (A) Heatmap depicting differentially expressed genes in WSU-DLCL2 treated with DMSO, pomalidomide (POM), GSK126 (GSK), or pomalidomide and GSK126 (P+G). Genes were hierarchically clustered (rows). In the heatmap, orange denotes upregulation, while blue denotes downregulation. (B) Gene set enrichment analysis (GSEA) of RNA-seq data. Significantly enriched gene sets in P+G relative to the remaining groups are shown as a bar chart. Asterisks indicate significance (** FDR < 0.01, and *** FDR < 0.001). (C) GSEA enrichment plot of the hematopoietic cell lineage pathway. (D) Genes involved in hematopoietic cell lineage were upregulated to a more significant extent in P+G than in other groups. (E) Genes essential for plasma cell differentiation were upregulated to a more significant extent in P+G than in other groups. (F,G) RT-qPCR analysis of mRNA levels of genes involved in hematopoietic cell lineage in WSU-DLCL2 and SU-DHL6 cells. (H,I) RT-qPCR analysis of mRNA levels of genes involved in plasma cell differentiation in WSU-DLCL2 and SU-DHL6. (J) WSU-DLCL2 and SU-DHL6 cells were treated with pomalidomide (Pom, 1 μM), GSK126 (1 μM), and P+G for 48 h. Cell lysates were analyzed via western blot using the indicated antibodies.


