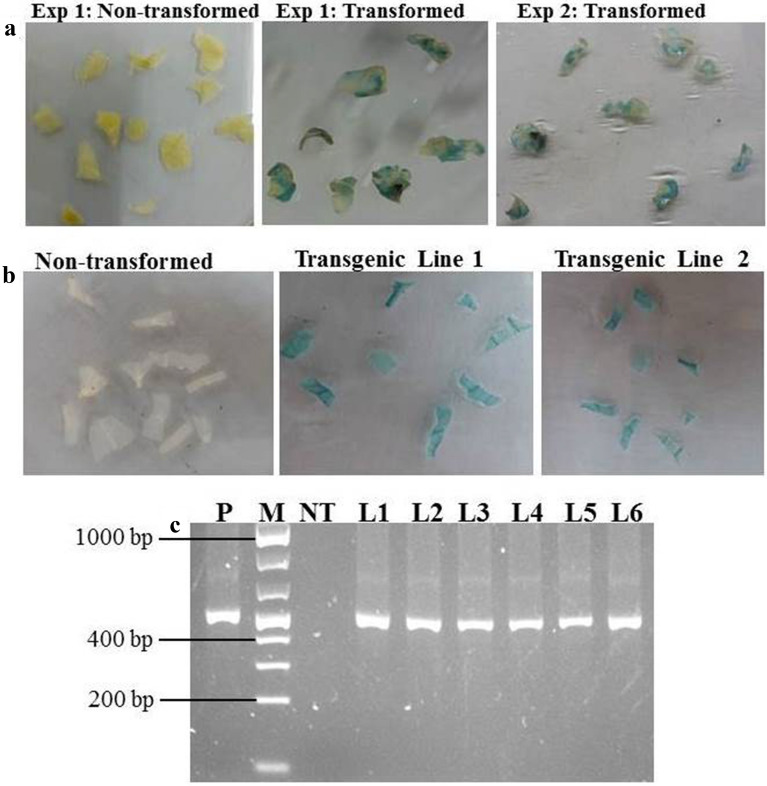
Fig. 4.
Histochemical β-glucuronidase staining and PCR analysis of transformed leaf discs and transgenic plants. a Histochemical GUS staining of leaf discs after co-cultivation for 3 days; b Stable histochemical GUS staining of leaf segments of different transgenic plant lines and non-transformed control plant; and c PCR amplification of gusA gene fragment of DNA isolated from 6 transgenic plant lines. P = plasmid DNA, M = 1 kb molecular weight marker (Fisher Thermo scientific); NT = Non-transformed control plant; and L1–L6 = Transgenic plant lines 1 to 6, respectively

