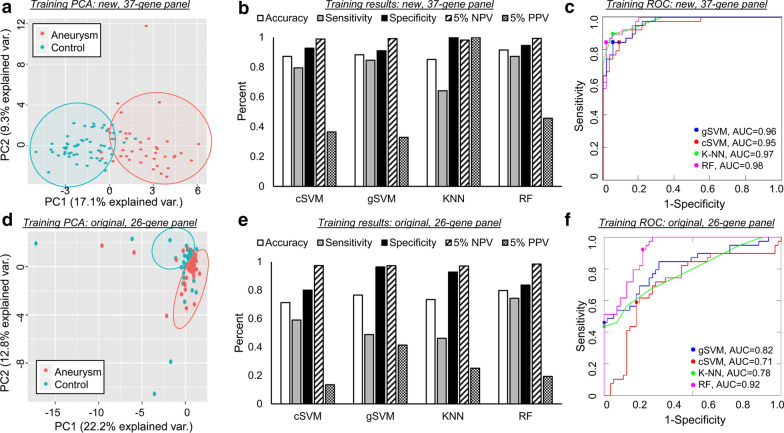
Fig. 4.
Models’ performance in the training dataset. a PCA using the 37 selected transcripts demonstrated clear separation between samples from patients with IA and those from controls. b Estimation of model performance during LOO C-V in the training cohort demonstrated that models performed with an accuracy of 0.85–0.91. Considering a 5% prevalence of IA, PPV ranged from 0.33–1 and NPV ranged from 0.98 to 0.99. c ROC analysis showed that all models had AUCs ≥ 0.95. d PCA using the 26 previously-identified transcripts demonstrated inferior separation between IA and control cases. e Estimation of model performance during LOO C-V in the training cohort demonstrated that models performed with an accuracy of 0.71–0.80. Considering a 5% prevalence, PPV and NPV ranged from 0.13–0.41 and 0.97–0.98, respectively. f ROC analysis also showed subpar performance compared to newly identified transcripts (AUC range 0.71–0.92). (AUC = area under the ROC curve, C-V = cross validation, cSVM = cubic support vector machines, gSVM = Gaussian support vector machines, KNN = k-nearest neighbors, LOO = leave-one-out, NPV = negative predictive value, PCA = principal component analysis, PPV = positive predictive value, RF = random forests, ROC = receiver operator characteristic)

