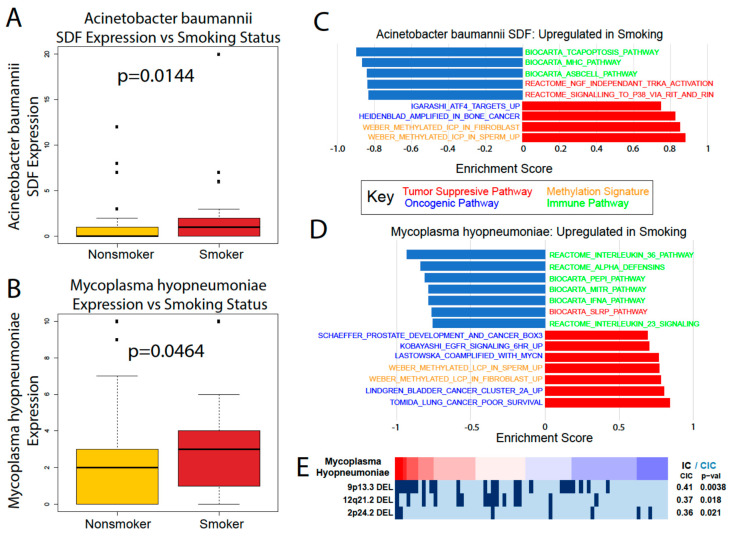
Figure 6.
Analysis of the smoking vs. nonsmoking PAAD microbiome. (A) A. baumannii and (B) M. hyopneumoniae were both upregulated in smokers versus nonsmokers according to the Kruskal–Wallis test (p < 0.05). GSEA analysis comparing the cancer and immune-associated pathways in smokers to the (C) A. baumannii and (D) M. hyopneumoniae abundance. (E) REVEALER analysis results for M. hyopneumoniae in smoking patients.

