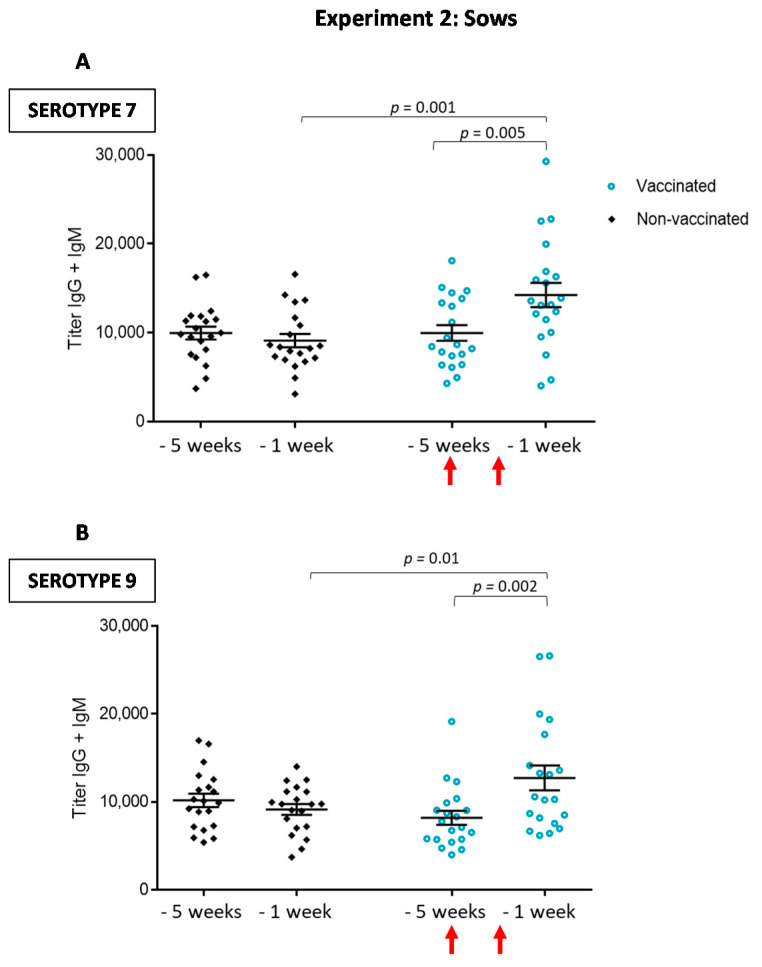
Figure 6.
Experiment 2: Total Ig levels against S. suis serotype 7 (A) or serotype 9 (B) in sows. Blood samples were collected one and five weeks before farrowing from 20 vaccinated and 20 non-vaccinated sows to follow the immune response. The vaccine was administered at five and three weeks before farrowing. Total Ig [IgG + IgM] titers were determined by ELISA. Antibody titers for individual sows are shown with horizontal bars representing mean ± SEM. Values significantly different are shown in the graph with corresponding p value. Arrows indicate first and second vaccination doses.

