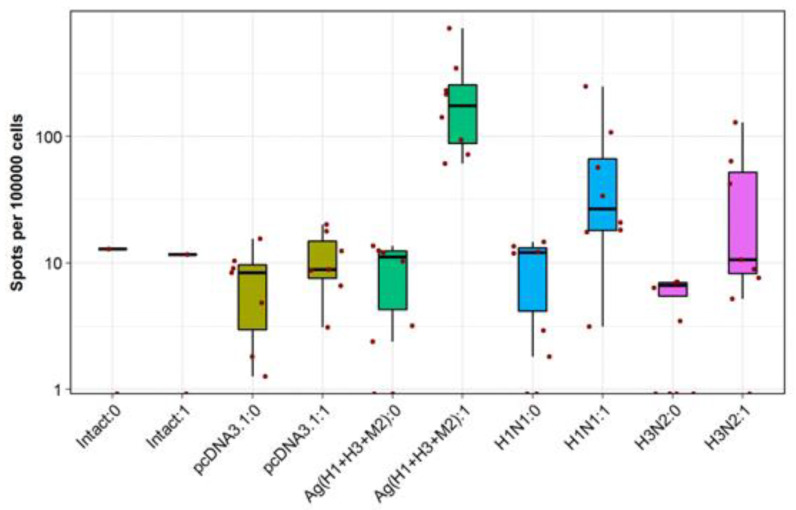
Figure 7.
Evaluation of cellular responses in immunized mice using the IFN-γ-ELISpot assay. Distinct colors designate the results observed in different experimental and control groups. “0” in the name of a group corresponds to a spontaneous IFN-γ secretion, and “1” corresponds to IFN-γ secretion stimulated with antigenic peptides. Cell counts are presented on a log scale (10 base).

