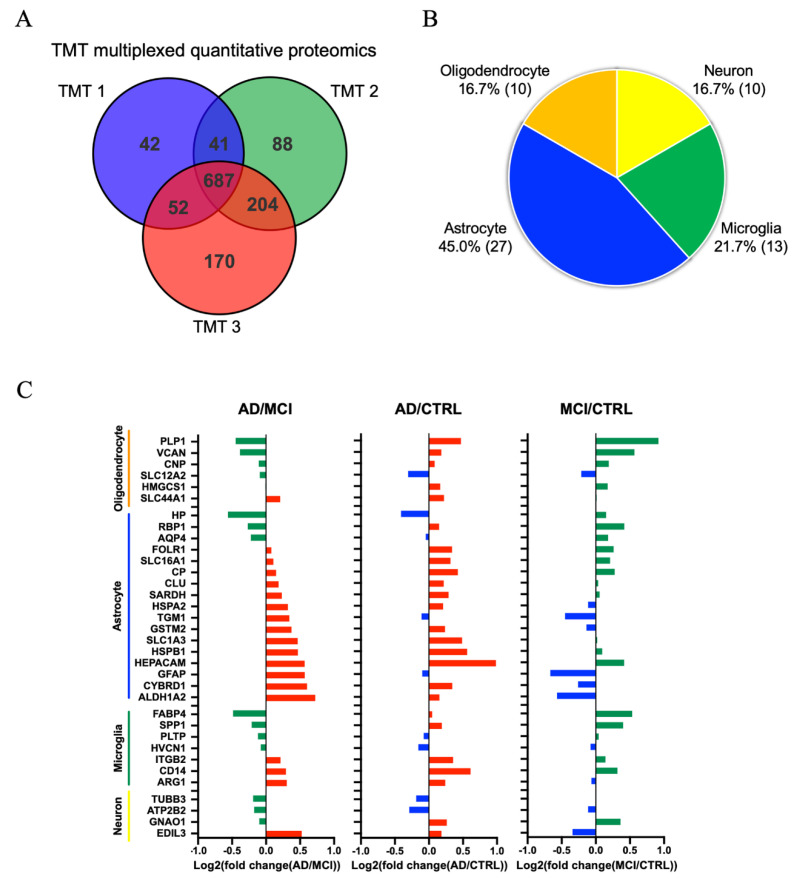
Figure 3.
Proteomics comparison of AD, MCI and CTRL CSF-derived EV protein: (A) Venn diagram showing the number of proteins reproducibly identified among the three separate TMT-MS. (B) Enrichment of brain cell-specific markers in CSF-derived EV proteins and brain-derived EV proteins. Yellow: Neuron, Green: Microglia, Blue: Astrocytes, Orange: Oligodendrocytes. The parentheses show the number of identified cell type-specific proteins. (C) Comparison of the cell type-specific proteins in AD CSF-derived EVs, MCI EVs and CTRL EVs. The left panel shows AD vs. MCI. The red bar shows higher expression in AD compared with MCI and the green bar indicates higher expression in MCI compared with AD. The middle panel indicates AD vs. CTRL. The red bar shows higher expression in AD compared with CTRL and the blue bar indicates higher expression in CTRL compared with AD. The right panel shows MCI vs. CTRL. The green bar shows higher expression in MCI compared with CTRL and the blue bar indicates higher expression in CTRL compared with MCI.

