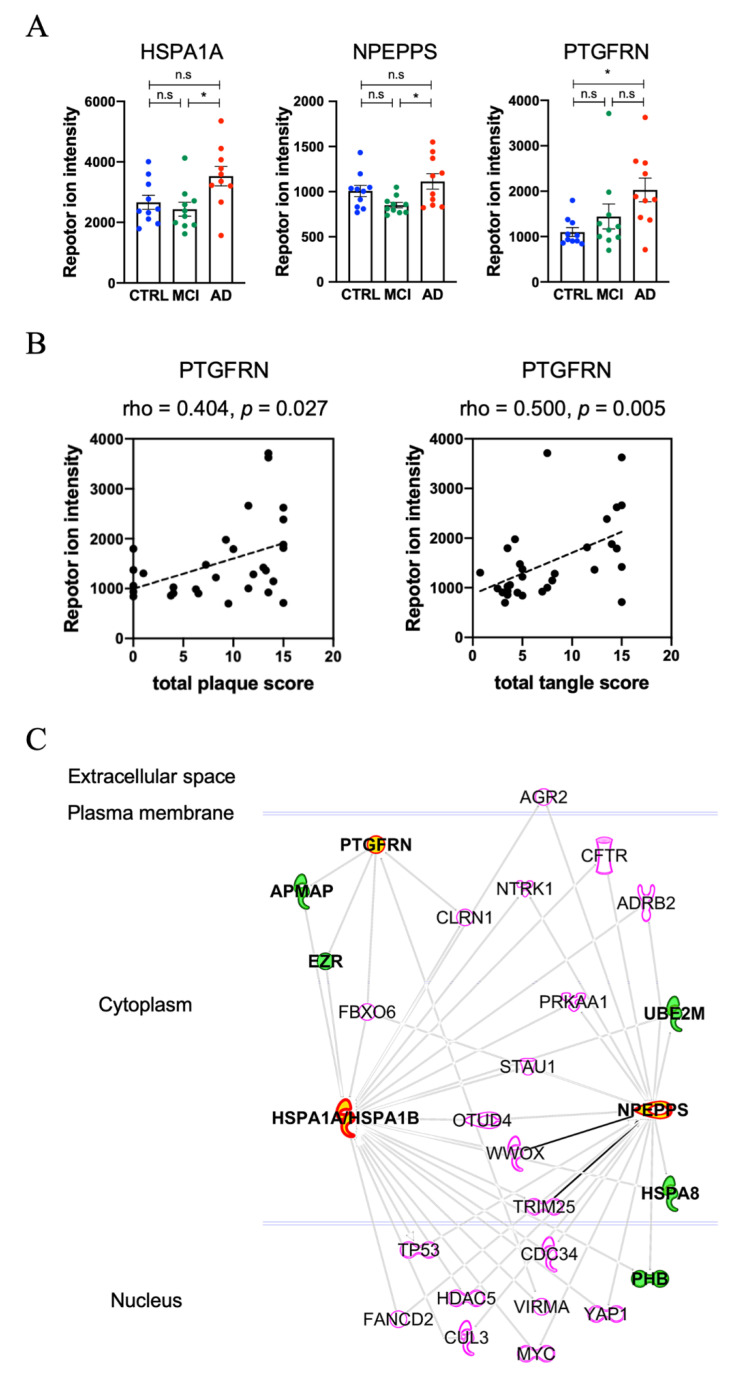
Figure 4.
Altered EV molecules during progression from MCI to AD: (A) A scatter plot of TMT reporter ion intensity as measured by proteomics per selected candidate protein (HSPA1A, NPEPPS, PTGFRN). One-way ANOVA, followed by Tukey’s-HSD multiple test (n.s: non-significant, * p < 0.05 for AD vs. MCI or AD vs. CTRL). (B) A scatter plot showing correlations between demography score and PTGFRN expression level, which was measured using TMT proteomics. The spearman’s rho for total plaque was 0.404 (p = 0.027), and for total tangle was 0.500 (p = 0.005). (C) Protein–Protein interaction networks of three candidate proteins identified by IPA. The red symbols represent three candidate proteins (HSPA1A, NPEPPS and PTGFRN), while the green symbols represent proteins identified by TMT-labeling proteomics.

