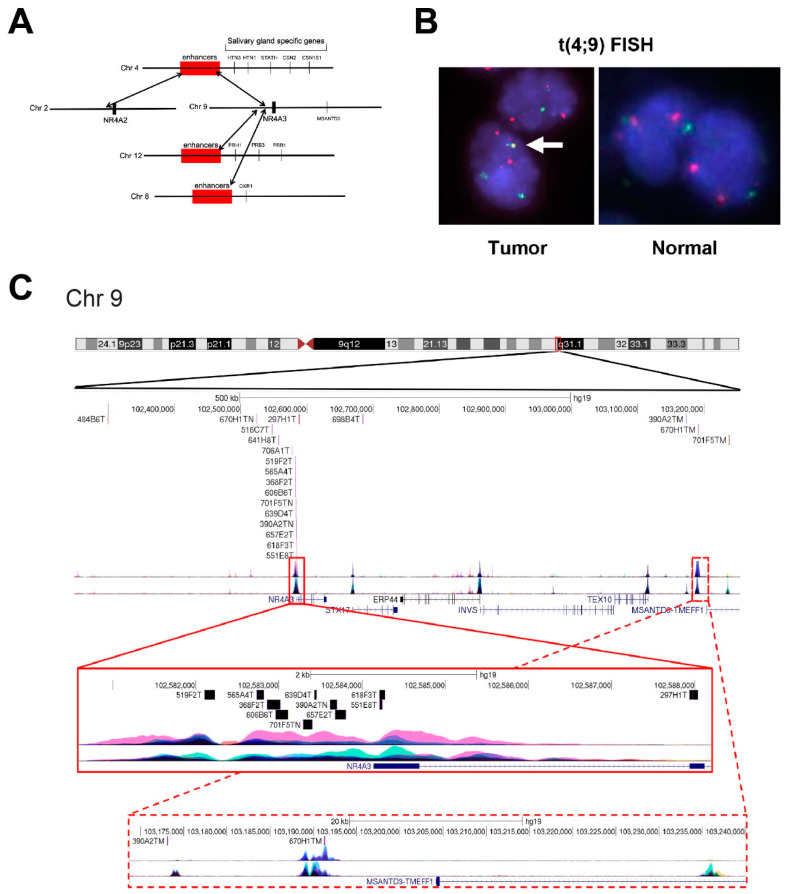
Figure 1.
Chromosome fusions in AcCC tumors. (A) Diagram summarizes the fusion reads and putative translocations detected by RNA-seq analysis; (B) fluorescence in situ hybridization (FISH) analysis to verify the t(4;9) translocation was performed for chromosome 4 (green) and chromosome 9 (red). Yellow signal (arrow) in the tumor is the fusion chromosome; (C) chromosome 9 breakpoints. Diagram of the chromosome 9q31.1 region, with locations of translocations identified by RNA-seq fusion reads indicated. Note the clustering of breakpoints in the NR4A3 gene promoter region. Two tumors also had fusion reads that mapped to the MSANTD3 region at right. The insets at bottom show zoomed views of the NR4A3 and MSANTD3 gene regions and the breakpoints near each. Colored peaks indicate H3K27Ac (top) and H3K4Me3 (bottom) peaks from UCSC genome browser tracks (not determined in AcCC cells).

