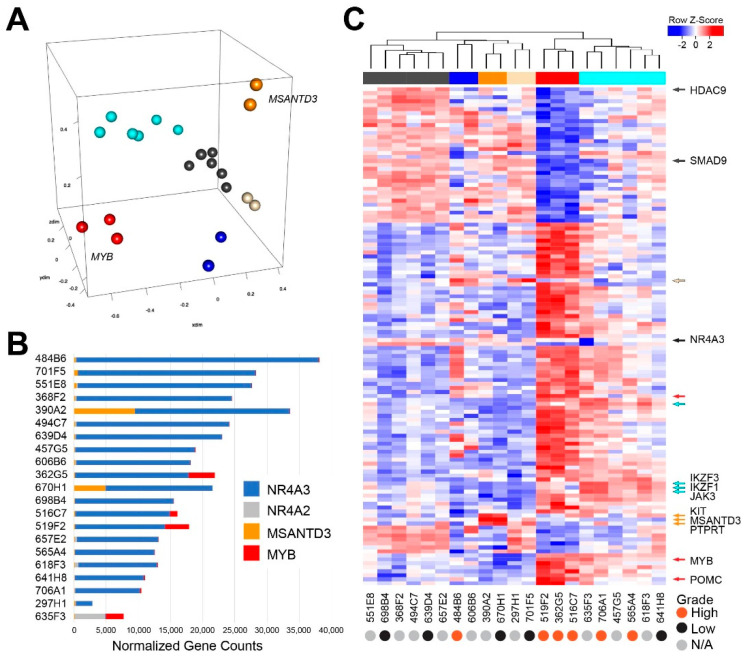
Figure 2.
RNA sequencing analysis of AcCC tumors. (A) Multidimensional scaling identifies several distinct groups of AcCC samples (shaded with different colors); (B) bar chart summarizes the normalized expression levels of NR4A3 (dark blue), NR4A2 (gray), MSANTD3 (orange) and MYB (red); (C) heatmap summarizes the most significant differences in gene expression among the six groups of AcCC tumors identified by hierarchical clustering, shown by the dendrogram and color bar at the top, which corresponds to the groups in panel A. Arrows along the right highlight genes characteristic for each group. Up- and downregulated genes are indicated by red and blue, respectively, as indicated in the key. Samples that had undergone high-grade transformation are indicated at bottom by orange dots. A full-sized heatmap with all the genes labeled is provided in Figure S2.

