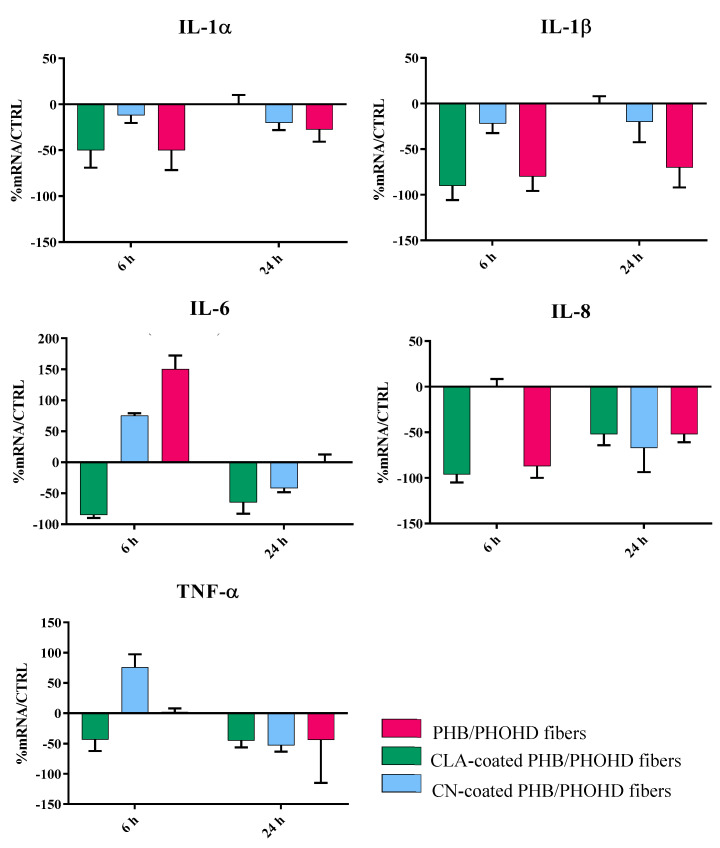
Figure 8.
Bar graphs showing the results of real time RT-PCR performed related to different cytokines involved in the inflammatory response of HaCaT cells after being exposed to the PHB/PHOHD fibers (plain, CLA-coated, and CN-coated) for 6 h and 24 h. The results were normalized by the expression in untreated cells as control.

