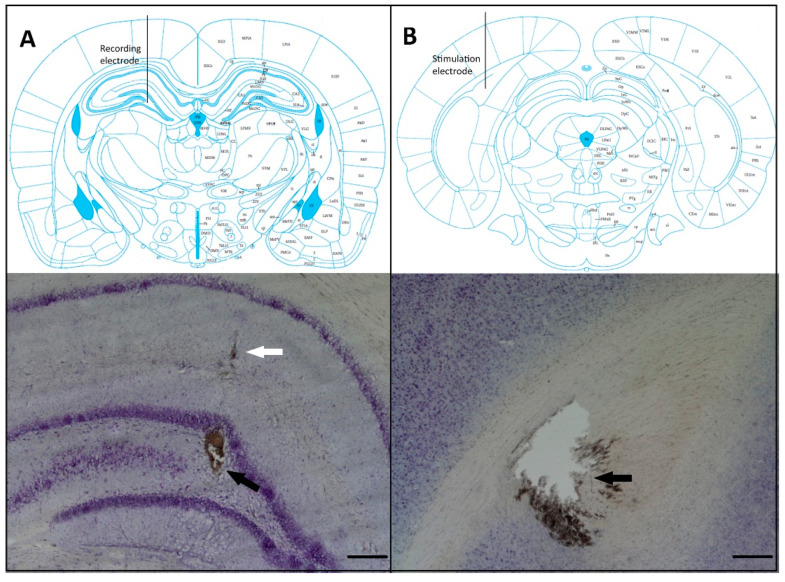
Figure 2.
Recording and stimulation electrode placement. (A) The top panel shows a schematic drawing of coronal sections illustrating the recording electrode placement in the hilus of the dentate gyrus (from Paxinos and Watson [40]). The bottom panel shows a photomicrograph of a Nissl-stained section showing the recording site of the extracellular field potentials (black arrow); the white arrow indicates the trajectory of the electrode. (B) The top panel shows a schematic drawing of the coronal section illustrating the stimulation electrode placement in the perforant pathway. The bottom panel shows a photomicrograph of a Nissl-stained section depicting the stimulation site (black arrow). Scale bars 250 μm.

