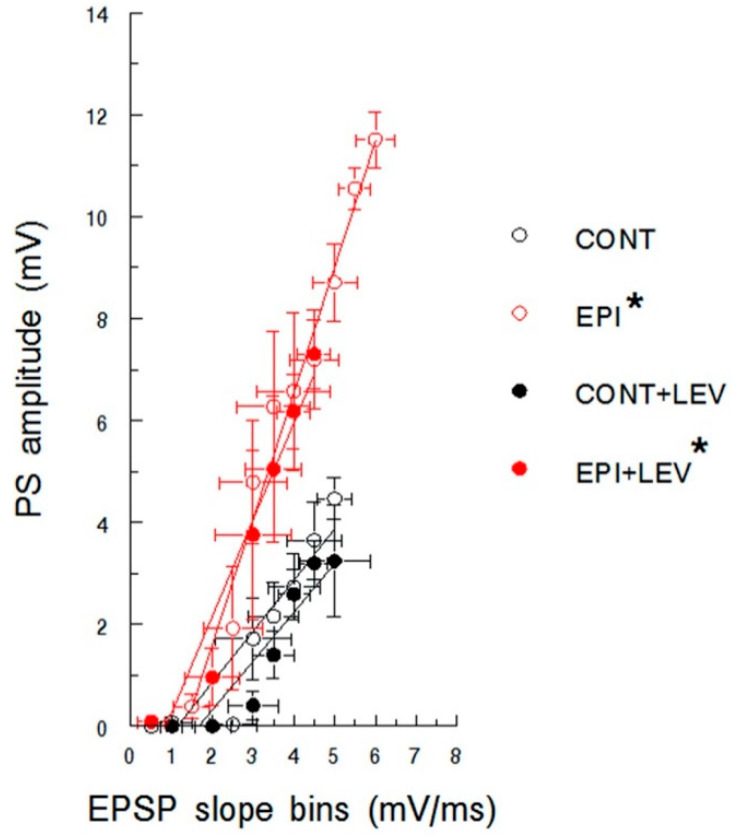
Figure 4.
Excitability curve plotting population spike (PS) amplitude as a function of excitatory postsynaptic potential (EPSP) slope in control (CONT) and epileptic (EPI) rats and control (CONT + LEV) and epileptic (EPI + LEV) rats after one week of levetiracetam (LEV) treatment (300 mg/kg/day). Field extracellular potentials were evoked in anesthetized rats by stimulation of the perforant path and were recorded in the dentate gyrus. EPSP slopes were sorted into 0.5 mV/ms bins. Data are presented as the means ± S.E.M. * p < 0.05 vs. CONT and CONT + LEV groups, Student’s t-test for comparing slopes.

