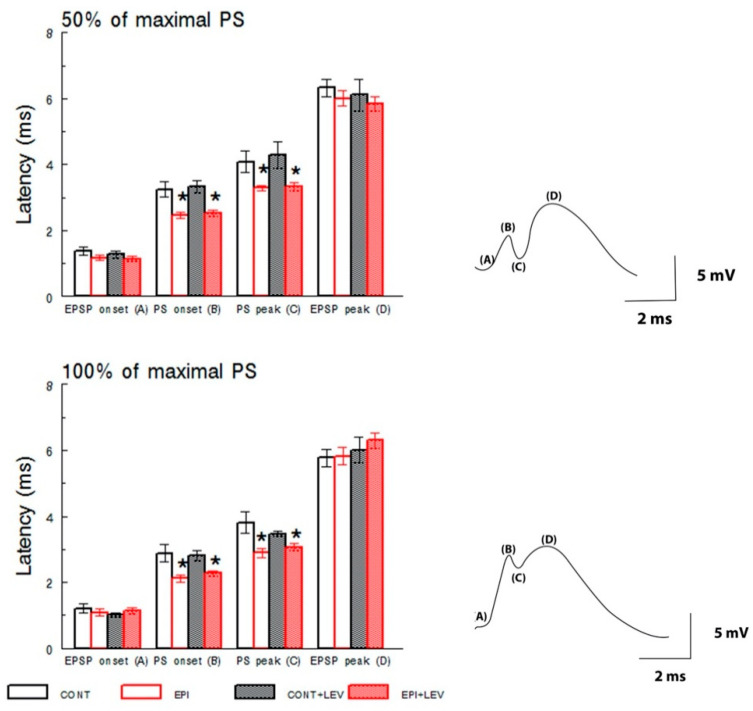
Figure 5.
Latencies of excitatory postsynaptic potentials (EPSPs) and population spike (PS) at intensities that produced 50% (top) or 100% (bottom) of the maximal PS according to the input–output curve in control (CONT) and epileptic (EPI) rats and control (CONT + LEV) and epileptic (EPI + LEV) rats after one week of levetiracetam (LEV) treatment (300 mg/kg/day). Field extracellular potentials were evoked in anesthetized rats by stimulation of the perforant path and were recorded in the dentate gyrus. Data are represented as the means ± S.E.M., * p < 0.05 vs. CONT and CONT + LEV groups; two-way ANOVA followed by the Student–Newman–Keuls post-hoc test; n = 6 to 9 animals per group. On the right, representative examples of traces showing the latencies of evoked field potentials are presented. EPSP onset (A), PS onset (B), PS peak (C) and EPSP peak (D).

