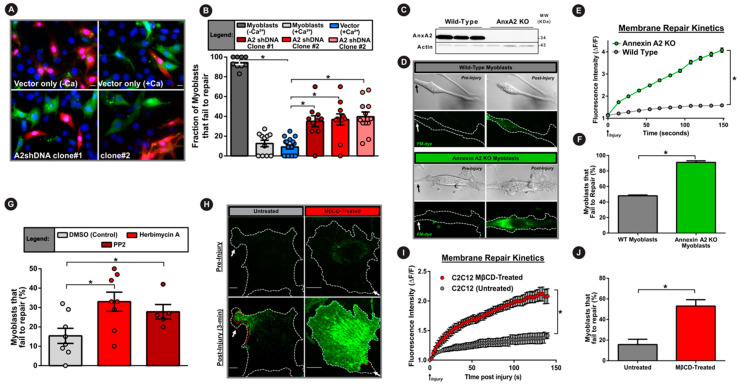
Figure 4.
Annexin A2 and its PM translocation are required for myoblast cell membrane repair. (A) Images of myoblasts subjected to glass bead injury in the presence of FITC dextran (green) followed by TRITC dextran (red) to mark cells that failed to repair. (B) Quantification of the proportion of injured myoblasts that fail to repair (300 cells per condition, n = 3). (C) Western blot demonstrating presence or complete lack of AnxA2 protein in primary myoblasts isolated from wild-type and AnxA2 knockout mice respectively. (D) Brightfield and confocal images of FM dye (green) fluorescence in primary myoblasts prior to or following laser injury. (E) Plot showing the kinetics of intracellular FM dye fluorescence intensity change during PM repair in wild-type (green) and AnxA2-knockout myoblasts (gray) (n = 12 cells per condition). (F) Plot quantifying of the proportion of primary myoblasts that fail to repair following laser membrane injury (60–70 cells per condition, n = 4). (G) Plot demonstrating the proportion of myoblasts that fail to repair from glass bead injury (as for A,B) following Src tyrosine kinase inhibition with herbimycin A or PP2 (200 cells per condition, n = 5). (H) Confocal images of untreated (left) or cholesterol-depleted (right) myoblasts pre- and 3 min. post injury (site marked by white arrow) in the presence of extracellular FM dye (green). (I) Plot showing the averaged kinetics of FM-dye entry in untreated and cholesterol-depleted cells (n = 30 cells each). (J) Plot quantifying the proportion of untreated or cholesterol-extracted C2C12 myoblasts that fail to repair (30 cells per condition, n = 3). Data is presented as mean ± SEM. * p < 0.05 vs. vector-control cells (B), wild-type cells (E,F), DMSO-treated cells (G), and MβCD-treated cells (I,J). Treatment induced differences in myoblast repair was assessed via one-way ANOVA (B,G) or an independent samples t-test (F,J). For kinetics analysis (E,I) mixed model ANOVA with analyses for interaction effects between treatment condition and time was used (* p < 0.05, main effect of condition). Scale bar = 10 µm.

