Figure 1.
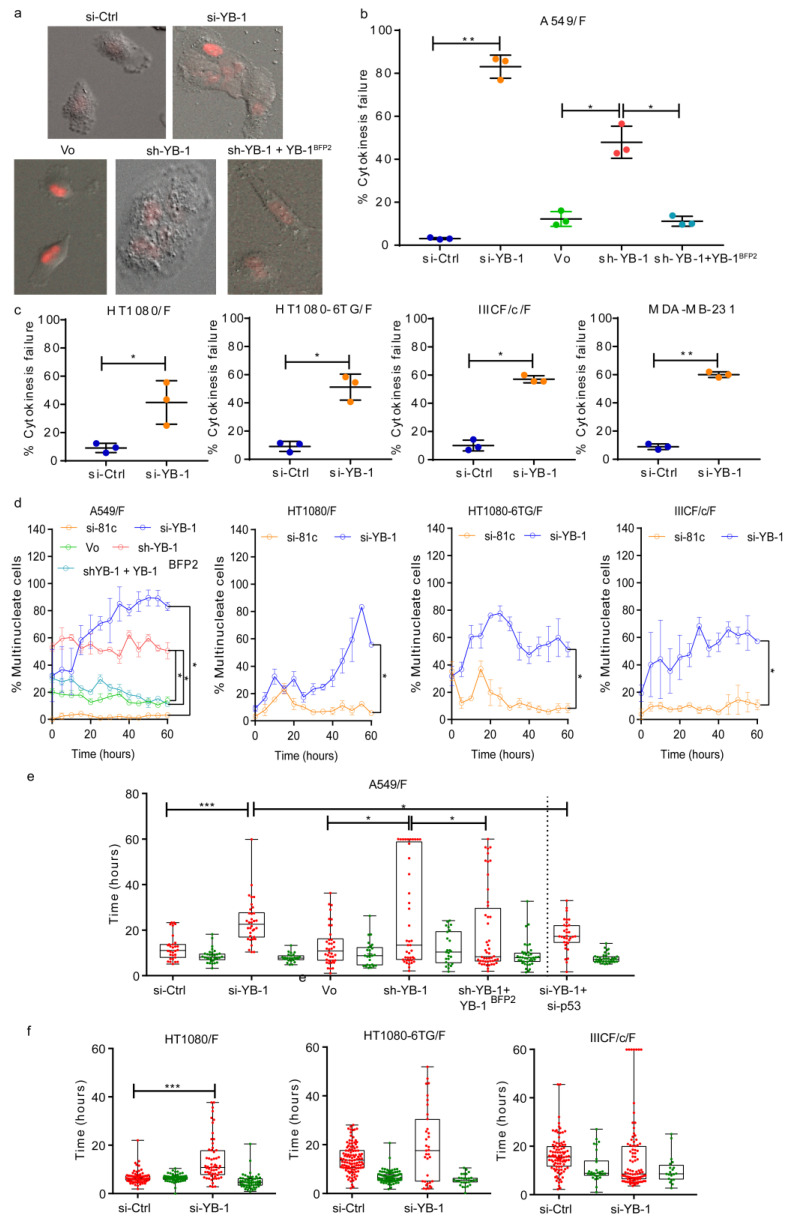
YB-1 depletion inhibits cytokinesis resulting in multinucleation and an increase in G1 transit time. (a) Examples of A549/F cells treated with control siRNA (si-Ctrl), YB-1 siRNA (si-YB-1), control plasmid (Vo), YB-1 short-hairpin (sh-YB-1) or sh-YB-1 + YB-1EBFP2. Images were acquired with a 20× objective. (b) Percentage of A549/F cells that fail cytokinesis treated with si-Ctrl, si-YB-1, sh-YB-1, or sh-YB-1 + shRNA-resistant YB-1EBFP2. (c) Percentage of cells that fail cytokinesis in HT1080/F, HT1080-6TG/F, IIICF/c/F and MDA-MB-231 cells treated with si-Ctrl and si-YB-1. (b,c). n ≥ 100 cells from three independent image fields from one experiment. Dot plots with lines shown mean ± s.d. and one-tailed Student’s t test, * p < 0.05, ** p < 0.01, ** p < 0.001. (d) Percentage of multinucleated cells in cultures treated with si-Ctrl, si-YB-1, Vo, sh-YB-1 and sh-YB-1 + YB-1EBFP2 24 h post transfection and followed for up to 80 h. Each point represents the mean ± s.e.m for three independent imaging fields from one experiment. Significance was determined using multiple t-tests with false discovery rate (FDR) correction, * p < 0.05. (e) Distribution of the G1 (red) and S-G2-M (green) phases of A549/F cells treated with either si-Ctrl, si-YB-1, si-YB-1 + si-p53, Vo, sh-YB-1 and sh-YB-1+ YB-1EBFP2. f. Distribution of G1 (red) and S-G2-M (green) phases of HT1080/F, HT1080-6TG/F and IIICF/c/F cells treated with either si-Ctrl or si-YB-1. (e,f) The line in the middle of each box represents the median, the top and bottom outlines of the box represent the first and third quartiles. Significance was determined using the Mann–Whitney U test, * p < 0.05, ** p < 0.01, *** p < 0.001 and **** p < 0.0001.

