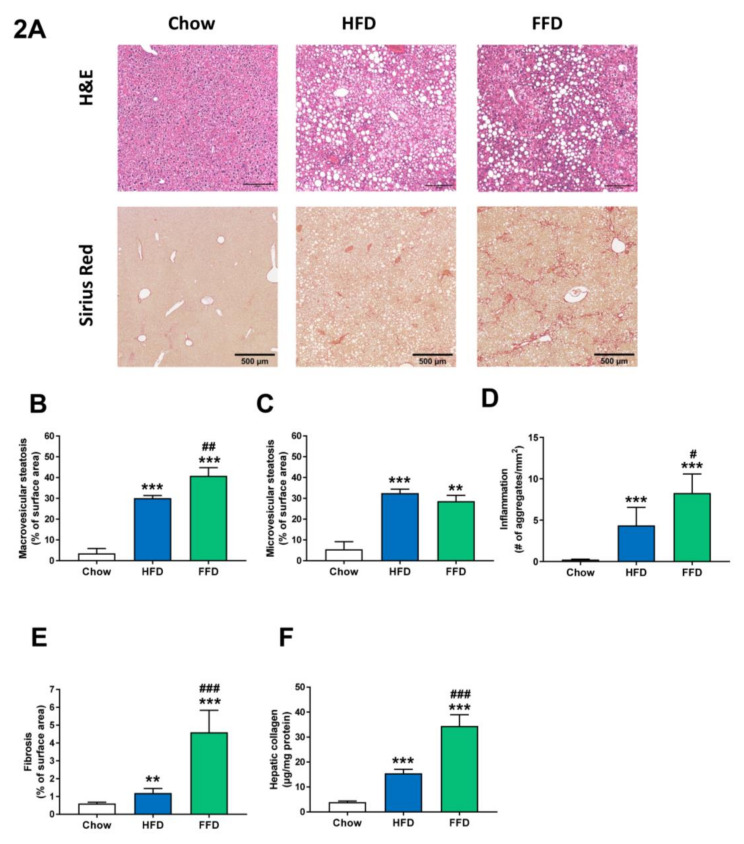
Figure 2.
Representative images of liver cross-sections stained with hematoxylin and eosin (H&E) or Sirius Red (A) and quantitative analysis (B–F) from Ldlr−/−.Leiden mice fed a healthy chow diet or fed a high-fat diet (HFD) containing lard or a fast food diet (FFD) containing milk fat for 28 weeks. Macrovesicular (B) and microvesicular (C) steatosis as a percentage of total liver area, inflammation as number of inflammatory aggregates per mm2 microscopic field (D), and hepatic fibrosis were analyzed as percentage Sirius Red of surface area (E) or biochemically analyzed hepatic collagen/mg protein (F). Values represent mean ± SEM for ≥8 mice per group. ** p < 0.01 and *** p < 0.001 vs. chow; # p < 0.05, ## p < 0.01 and ### p < 0.001 FFD vs. HFD.

