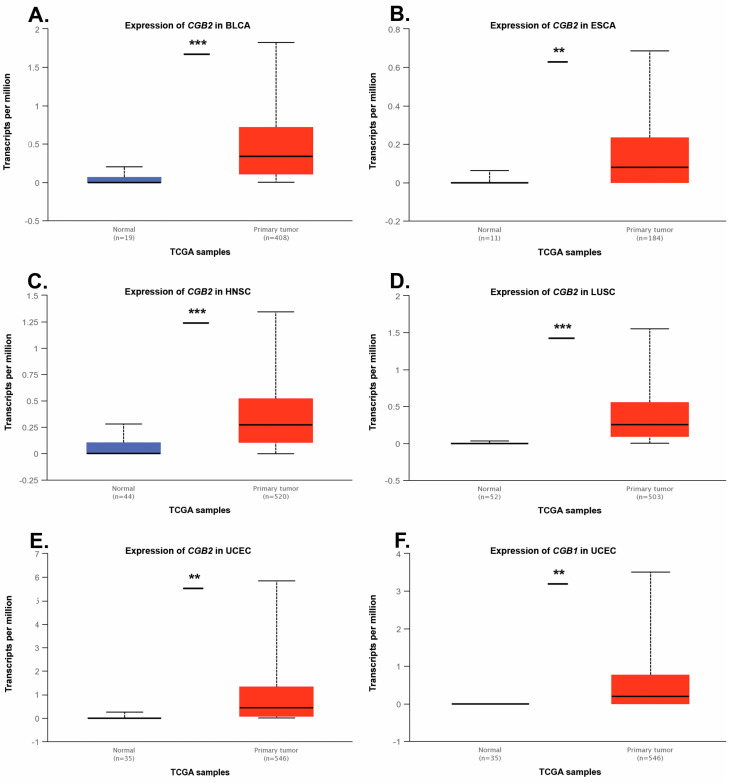
Figure 3.
Expression levels of CGB1 and CGB2 in primary tumor samples and corresponding healthy tissues according to data deposited in the UALCAN database. (A) Expression of CGB2 in BLCA, (B) expression of CGB2 in ESCA, (C) expression of CGB2 in HNSC, (D) expression of CGB2 in LUSC, (E) expression of CGB2 in UCEC, (F) expression of CGB1 in UCEC. ** p ≤ 0.01; *** p ≤ 0.001.

