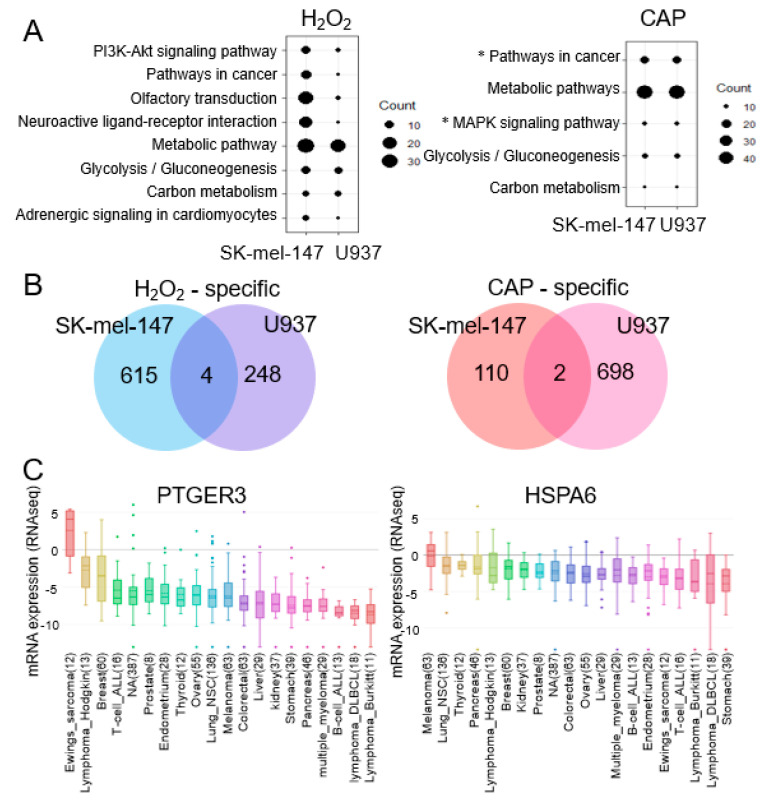
Figure 2.
Pathway analysis of genes deregulated by H2O2 and CAP. (A) KEGG pathway analysis of genes regulated by H2O2 or CAP. Pathways observed in both U937 and SK-mel-147 cells are shown. The larger the size of the circle, the more genes included in the pathway. The ‘MAPK pathway’ and ‘Pathways in cancer’, which include PTGER3 and HSPA6 from CAP-treated cells, are indicated with an asterisk (*). (B) Venn diagram of common genes regulated in U937 and SK-mel-147 cells by H2O2 or CAP. There were four and two common genes significantly altered by H2O2 and CAP, respectively, in both cells. (C) Expression profile of PTGER3 and HSPA6 in various tumors. The expression level of the genes was extracted from the CCLE database and aligned with the box plot. The horizontal line indicates the expression level of control normal tissues. The numeric value in the parenthesis represents the number of examined tissues.

