Figure 3.
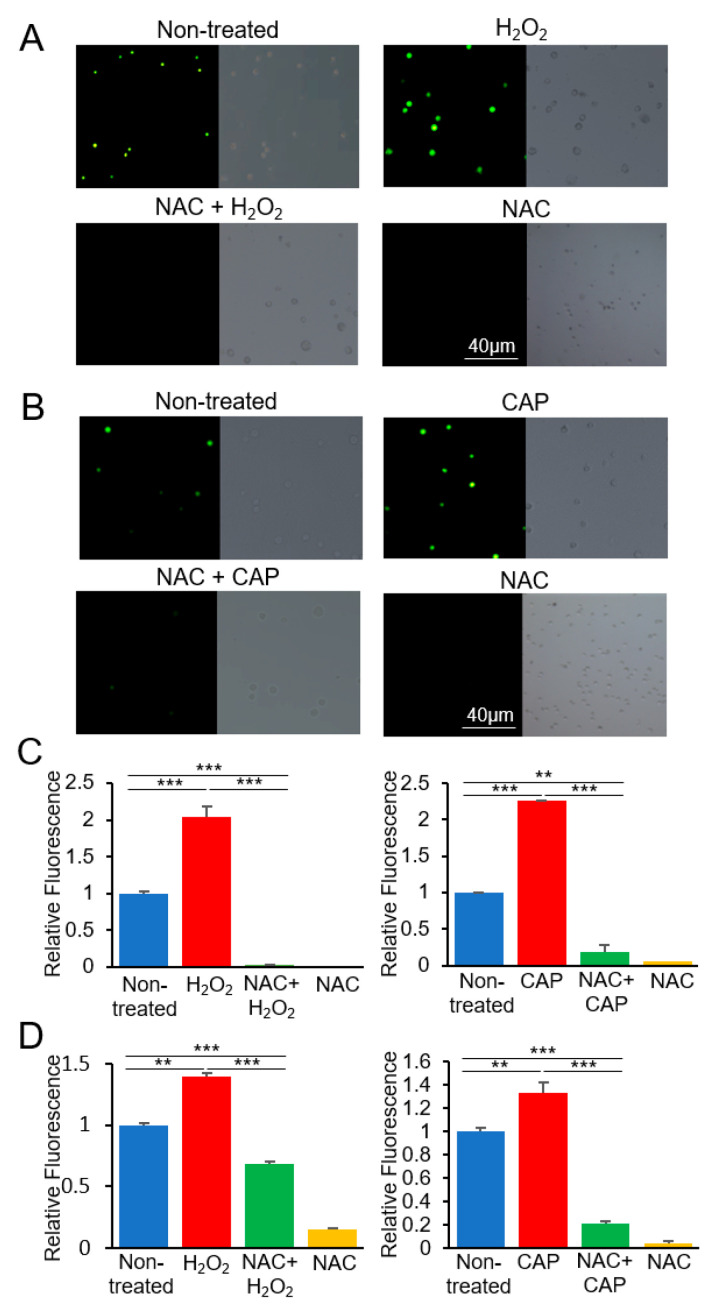
Production of reactive oxygen species (ROS) by H2O2 and CAP in U937 cells. U937 cells were treated with H2O2 or CAP with N-acetyl-L-cysteine (NAC), and the fluorescence intensity was observed using a microscope. Fluorescent images were obtained after treating the cells with (A) H2O2 and NAC or (B) CAP and NAC. Bright-field microscopy images are shown next to fluorescent images. Experiments were performed in triplicate, and representative images are shown. The bar graph shows the fluorescence intensity measured by ImageJ (C) and a microreader (D) (mean ± SE). Relative intensity of samples to the non-treated is indicated. ** p < 0.01, *** p < 0.001.

