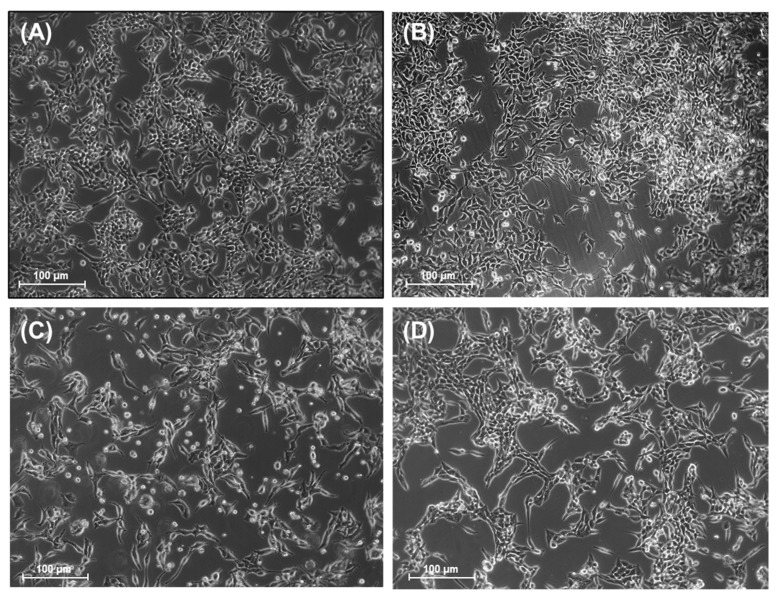
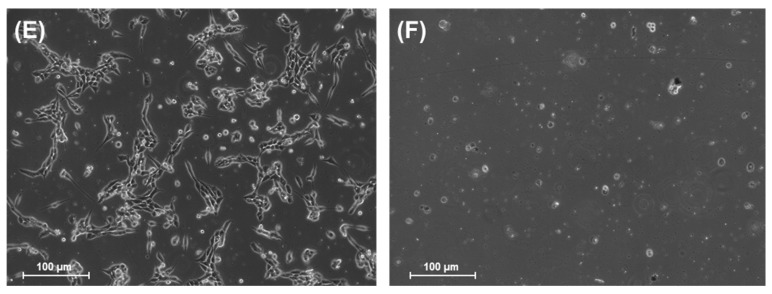
Figure 2.
Analysis of morphological changes in A2780 tumor cells treated with EHGV. (A) Untreated A2780 control cells; (B) A2780 cells treated with vehicle (10% (v/v) DMSO); (C) A2780 cells treated with CDDP 10 μM; (D–F) A2780 cells treated with 15.62, 31.25 and 62.5 μg/mL EHGV, respectively. Cells were exposed to various concentrations of EHGV, CDDP and DMSO vehicle control and morphological changes were observed following 48 h of treatment. The cells were photographed (magnification 10×) with Axio-Vision Rel. 4.8 software. Scale bar = 100 μm.


