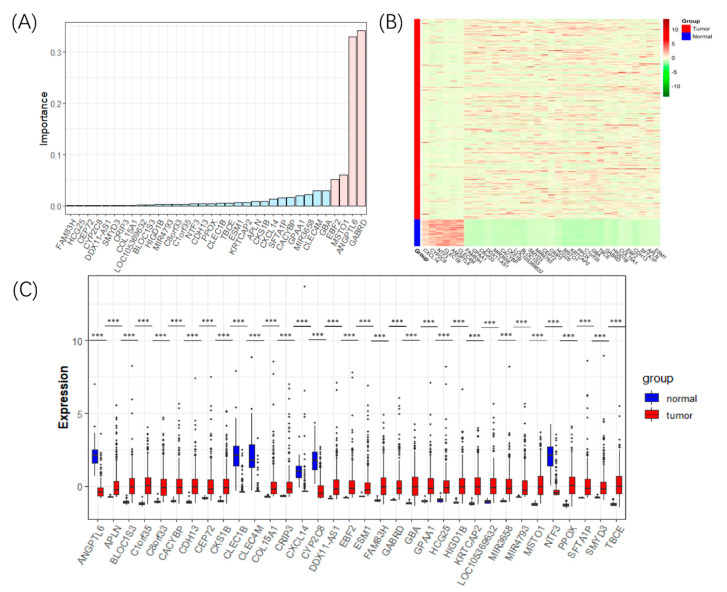
Figure 2.
The detected 34 DEGs for LIHC. (A) The bar plot of the importance values of the 34 DEGs, in which the genes’ importance scores above 0.05 were marked pink, and the rest were marked sky blue. (B) The heat map showing the expression level of the 34 DEGs in the tumors and normal samples. (C) Boxplots comparing the expression level of the 34 DEGs in the tumors and normal samples. Three stars (***) marks DEGs whose p-value < 0.001.

