
Figure 1.
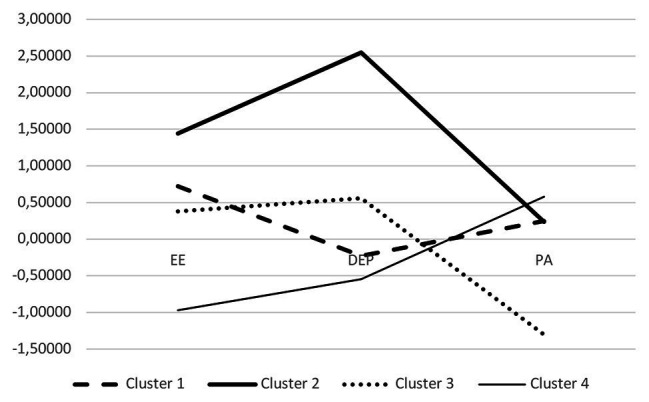
Plot of means for each variable according to clusters. Cluster 1, medium risk burnout; Cluster 2, high burnout; Cluster 3, high risk burnout; Cluster 4, low burnout.
Official websites use .gov
A
.gov website belongs to an official
government organization in the United States.
Secure .gov websites use HTTPS
A lock (
) or https:// means you've safely
connected to the .gov website. Share sensitive
information only on official, secure websites.
Plot of means for each variable according to clusters. Cluster 1, medium risk burnout; Cluster 2, high burnout; Cluster 3, high risk burnout; Cluster 4, low burnout.