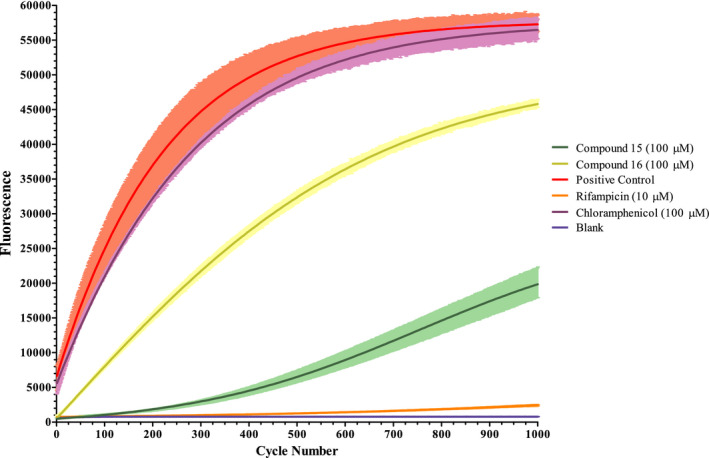
Figure 7.

Broken beacon RNA polymerase assay. The plotted lines denote the average fluorescence values from three test wells from 1000 read cycles of 30 seconds. Error bars are shown in lighter colors. The blank shows the base fluorescence from probe dehybridization
