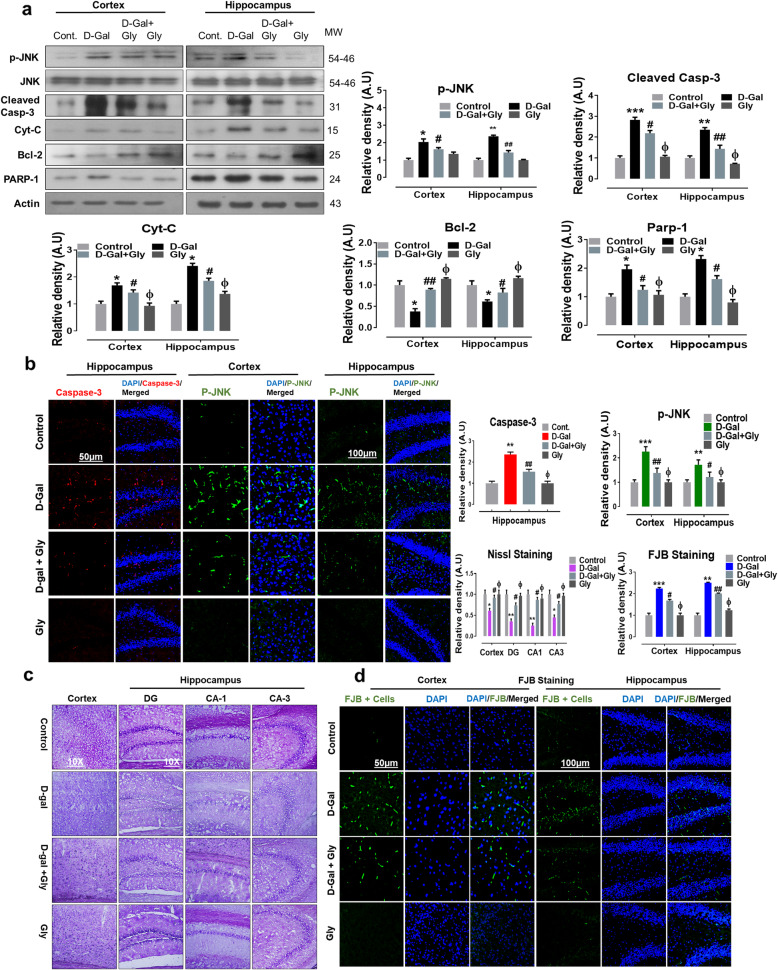
Fig. 3.
Glycine treatment inhibited d-galactose-induced elevated p-JNK and apoptotic cell death in mice brain. a Representative western blot analysis of stress kinase phosphorylated (p-JNK), cleaved caspase-3, cytochrome c (Cyt. C), Bcl-2 (B-cell lymphoma 2), and PARP-1 (poly-ADP-ribosyltransferase) proteins expression levels in both cortex and hippocampus regions of mice brain. The cropped bands were quantified using ImageJ software, and the differences are represented in the histogram. The density values are expressed in arbitrary units (A.U.) as the mean ± SEM for the respective indicated protein. An anti-β-actin antibody was used as a loading control. n = 8 mice/group, and the number of experiments performed N = 3. b Representative immunofluorescence results of caspase-3 (red; in hippocampus) and activated p-JNK proteins (green; in cortex and hippocampus) of the experimental mice group and c, d Nissl (cortex, DG, CA1, and CA3 regions) FJB staining (green, FITC; Blue) in cortex and hippocampus regions of experimental mice brain. The relative integrated density values are represented in arbitrary units (A.U) as the means (± S.E.M) for the respective indicated proteins. DAPI (blue) was used for nucleus staining. n = 8 mice/group, and the number of experiments = 3. Magnification × 40. Scale bar; 50 μm = cortices; DG hippocampal regions =100 μm. Asterisk (*) sign indicated significant difference from the normal saline treated group; hash (#) sign indicated significant difference from d-gal-treated group; while the phi (Φ) sign indicated no significance from normal saline-treated control group. Significance: *P ≤ 0.05, **P ≤ 0.01; ***P ≤ 0.001; #P ≤ 0.05, ##P ≤ 0.01

