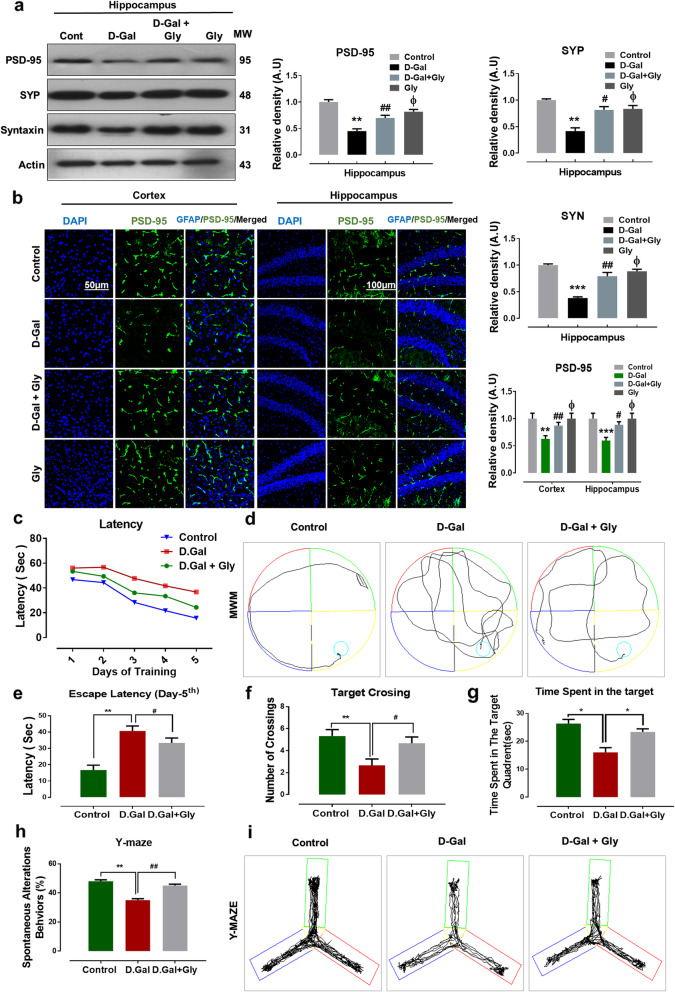
Fig. 5.
Gly inhibited d-galactose-induced synaptic and memory dysfunction in C57BL/6 mice brain. a Western blot analysis of presynaptic proteins including synaptophysin (SYP), syntaxin (SYN), and postsynaptic density proteins (PSD95) in the hippocampus of different experimental groups The cropped bands were quantified using ImageJ software, and the differences are represented in the histogram. The density values are expressed in arbitrary units (A.U.) as the mean ± SEM for the respective indicated protein. An anti-β-actin antibody was used as a loading control. n = 8 mice/group, and the number of experiments performed N = 3. b The immunofluorescence images represented the immunoreactivity of PSD95 (green, FITC; blue, DAPI) in cortex and hippocampus of mice brain; along with their relative histograms, respectively. The relative integrated density values are represented in arbitrary units (A.U) as the means (± S.E.M) for the respective indicated proteins. DAPI (blue) was used for nucleus staining. n = 8 mice/group, and the number of experiments performed N = 3. Magnification × 40. Scale bar; 50 μm = cortices; DG hippocampal regions = 100 μm. c Mean escape latency in seconds to reach the hidden platform during training (5 days) along d with representative trajectories; f number of target crossings; g the time spent in the target quadrant; h Y-maze analysis represented spontaneous alteration behaviors along with its representative trajectories of mice. For behavioral study, the number of mice (n = 16) per experimental group was used. Asterisk (*) sign indicated significant difference from the normal saline treated group; hash (#) sign indicated significant difference from d-gal-treated group; while the phi (Φ) sign indicated no significance from normal saline-treated group

