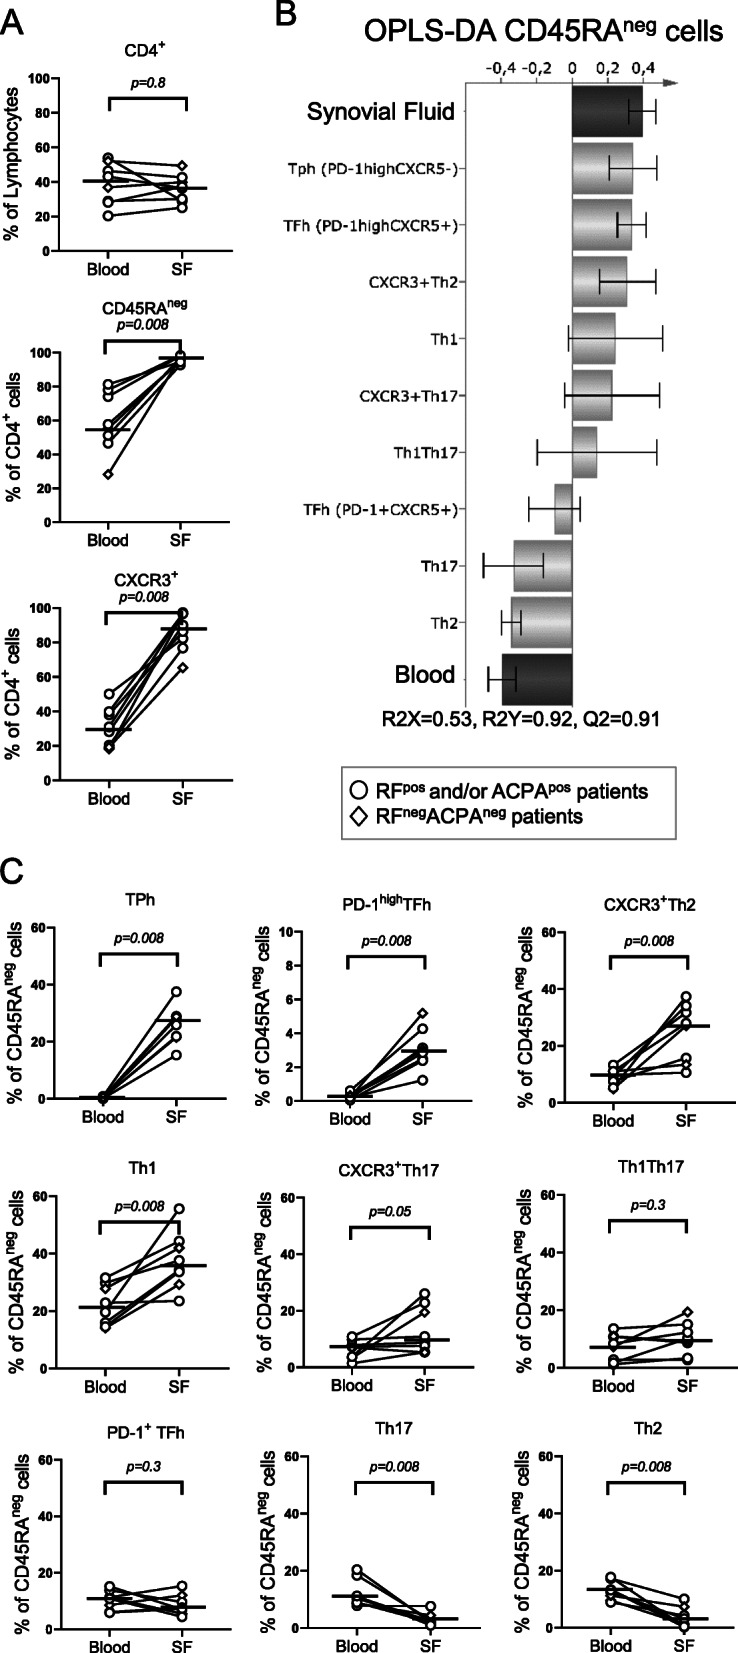
Fig. 2.

Distribution of memory T helper (Th) cell subsets in paired blood and synovial fluid (SF) from patients with rheumatoid arthritis (RA). a Comparison of the proportions of total CD4+ lymphocytes, CD45RAnegCD4+ memory T cells and CXCR3+CD4+ T cells in blood and SF of patients with RA (n = 8). b OPLS-DA column loading plots showing the association of CD45RAneg Th subset proportions (X-variables) to either SF or blood (Y-variables). c Comparison of the proportions of TPh, PD-1highTFh, CXCR3+Th2, Th1, CXCR3+Th17, Th1Th17, PD-1+ TFh, Th17 and Th2 subsets of CD45RAnegCD4+ lymphocytes in blood and SF (gating strategy shown in Supplementary Figure 1). Horizontal bars indicate median. P value denotes the statistical significance of the difference between T cell proportions in blood and SF (Wilcoxon matched-pairs signed rank)
