
Figure-6.
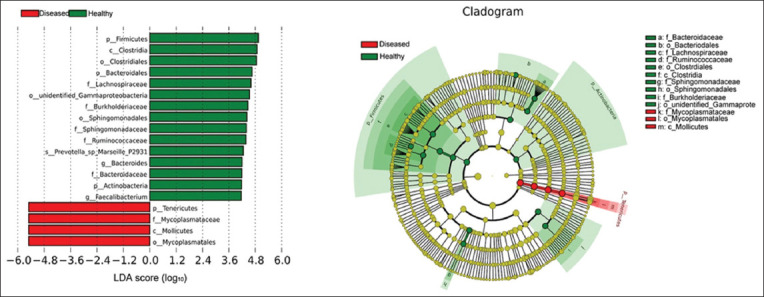
LDA value distribution histogram and evolutionary branch diagram. The histogram for the distribution of LDA values shows species with LDA scores of log10 >4. In the evolutionary branch diagram, the circle radiating from the inside to the outside represents the classification level from phylum to genus. Each small circle at the different classification levels represents a classification at that level, and the diameter of the small circle is proportional to the relative abundance. Species with no significant differences are colored yellow.