
Figure-2.
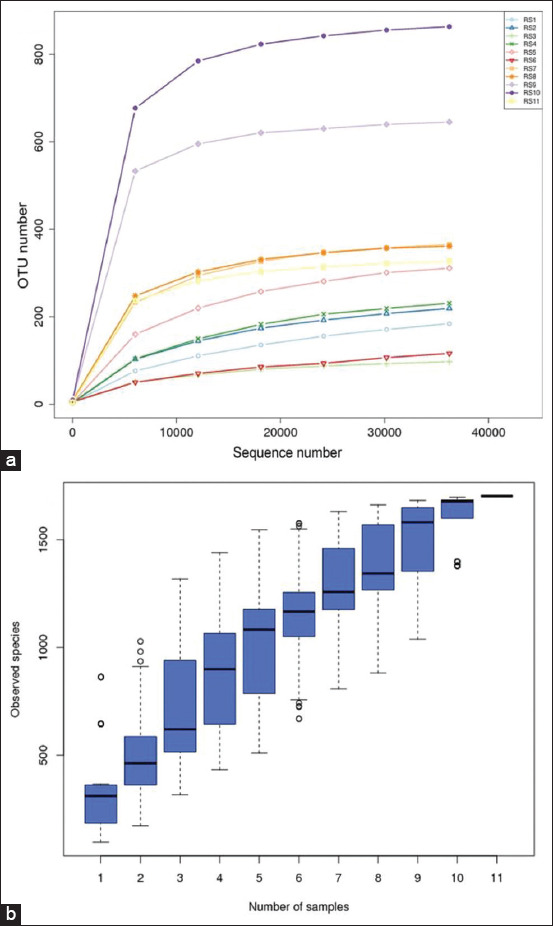
Relationship among sequencing data, sample size, and species diversity. Different samples are represented by curves of different colors. (a) Dilution curve. (b) Species accumulation box chart.
Official websites use .gov
A
.gov website belongs to an official
government organization in the United States.
Secure .gov websites use HTTPS
A lock (
) or https:// means you've safely
connected to the .gov website. Share sensitive
information only on official, secure websites.
Relationship among sequencing data, sample size, and species diversity. Different samples are represented by curves of different colors. (a) Dilution curve. (b) Species accumulation box chart.