
FIG 3.
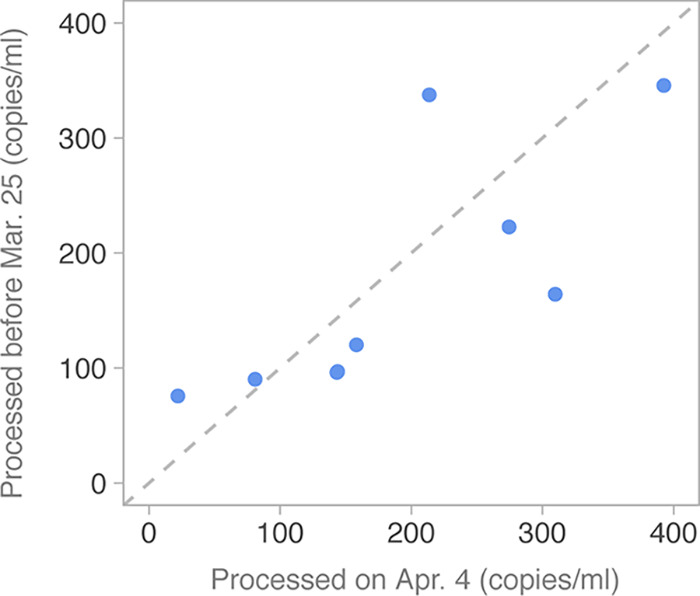
Sample stability over time. Estimated copies per milliliter of sewage estimated from the same samples filtered and processed on different dates. The y axis shows samples processed between 20 and 25 March 2020, and these are plotted against samples reprocessed on 4 April 2020 (samples were pasteurized upon receipt and stored at 4°C until processing). The gray dashed line corresponds to y = x. Each point represents an average over all three primer sets for each sample.