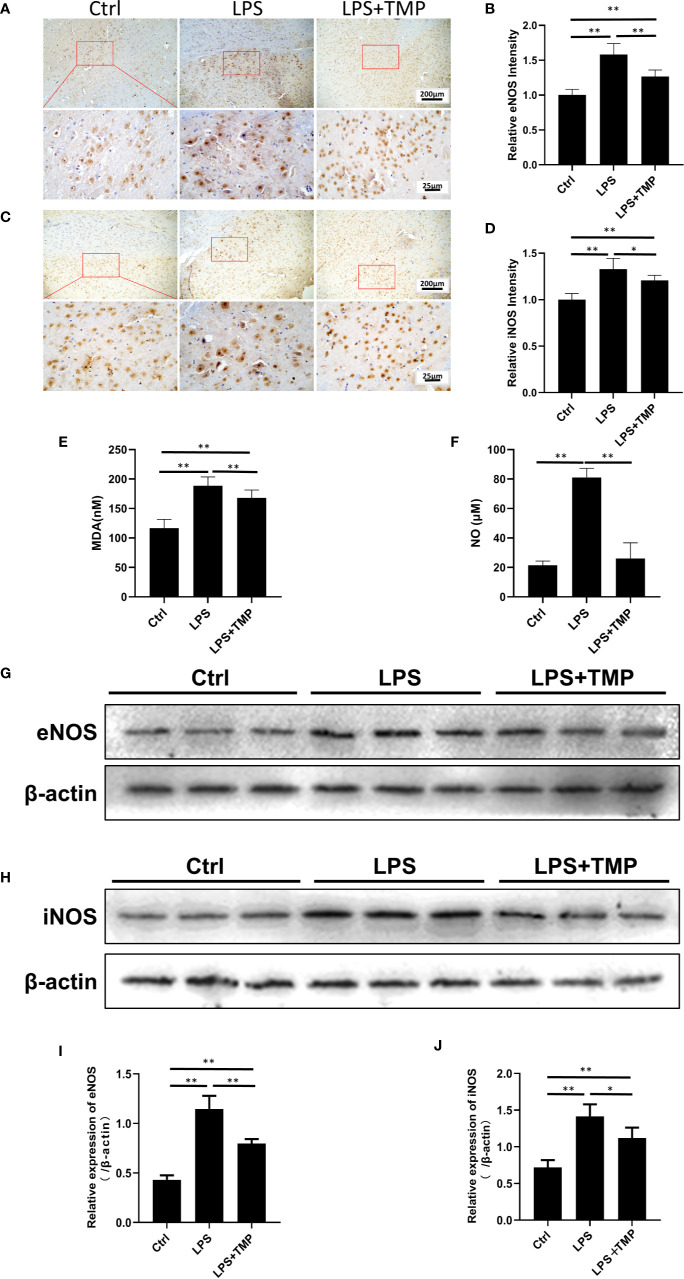
Figure 5.
Effects of TMP on NOS and serum MDA and NO. (A) IHC staining of the eNOS in cerebral cortex of the rats (Upper, 100×; Lower, 400×). (B) The relative IHC intensity of eNOS protein; (C) IHC staining of the iNOS in cerebral cortex of the rats (Upper, 100×; Lower, 400×). (D) The relative IHC intensity of iNOS protein; (E, F) Serum MDA and NO contents in the control group, LPS group and LPS+TMP group (n=8). (G–J) Western blot was used to detect the expression levels of eNOS and iNOS in rat cerebral cortex and histogram shown the quantified results. Compared with the LPS group, *P < 0.05, **P < 0.01.

