
Fig. 1.
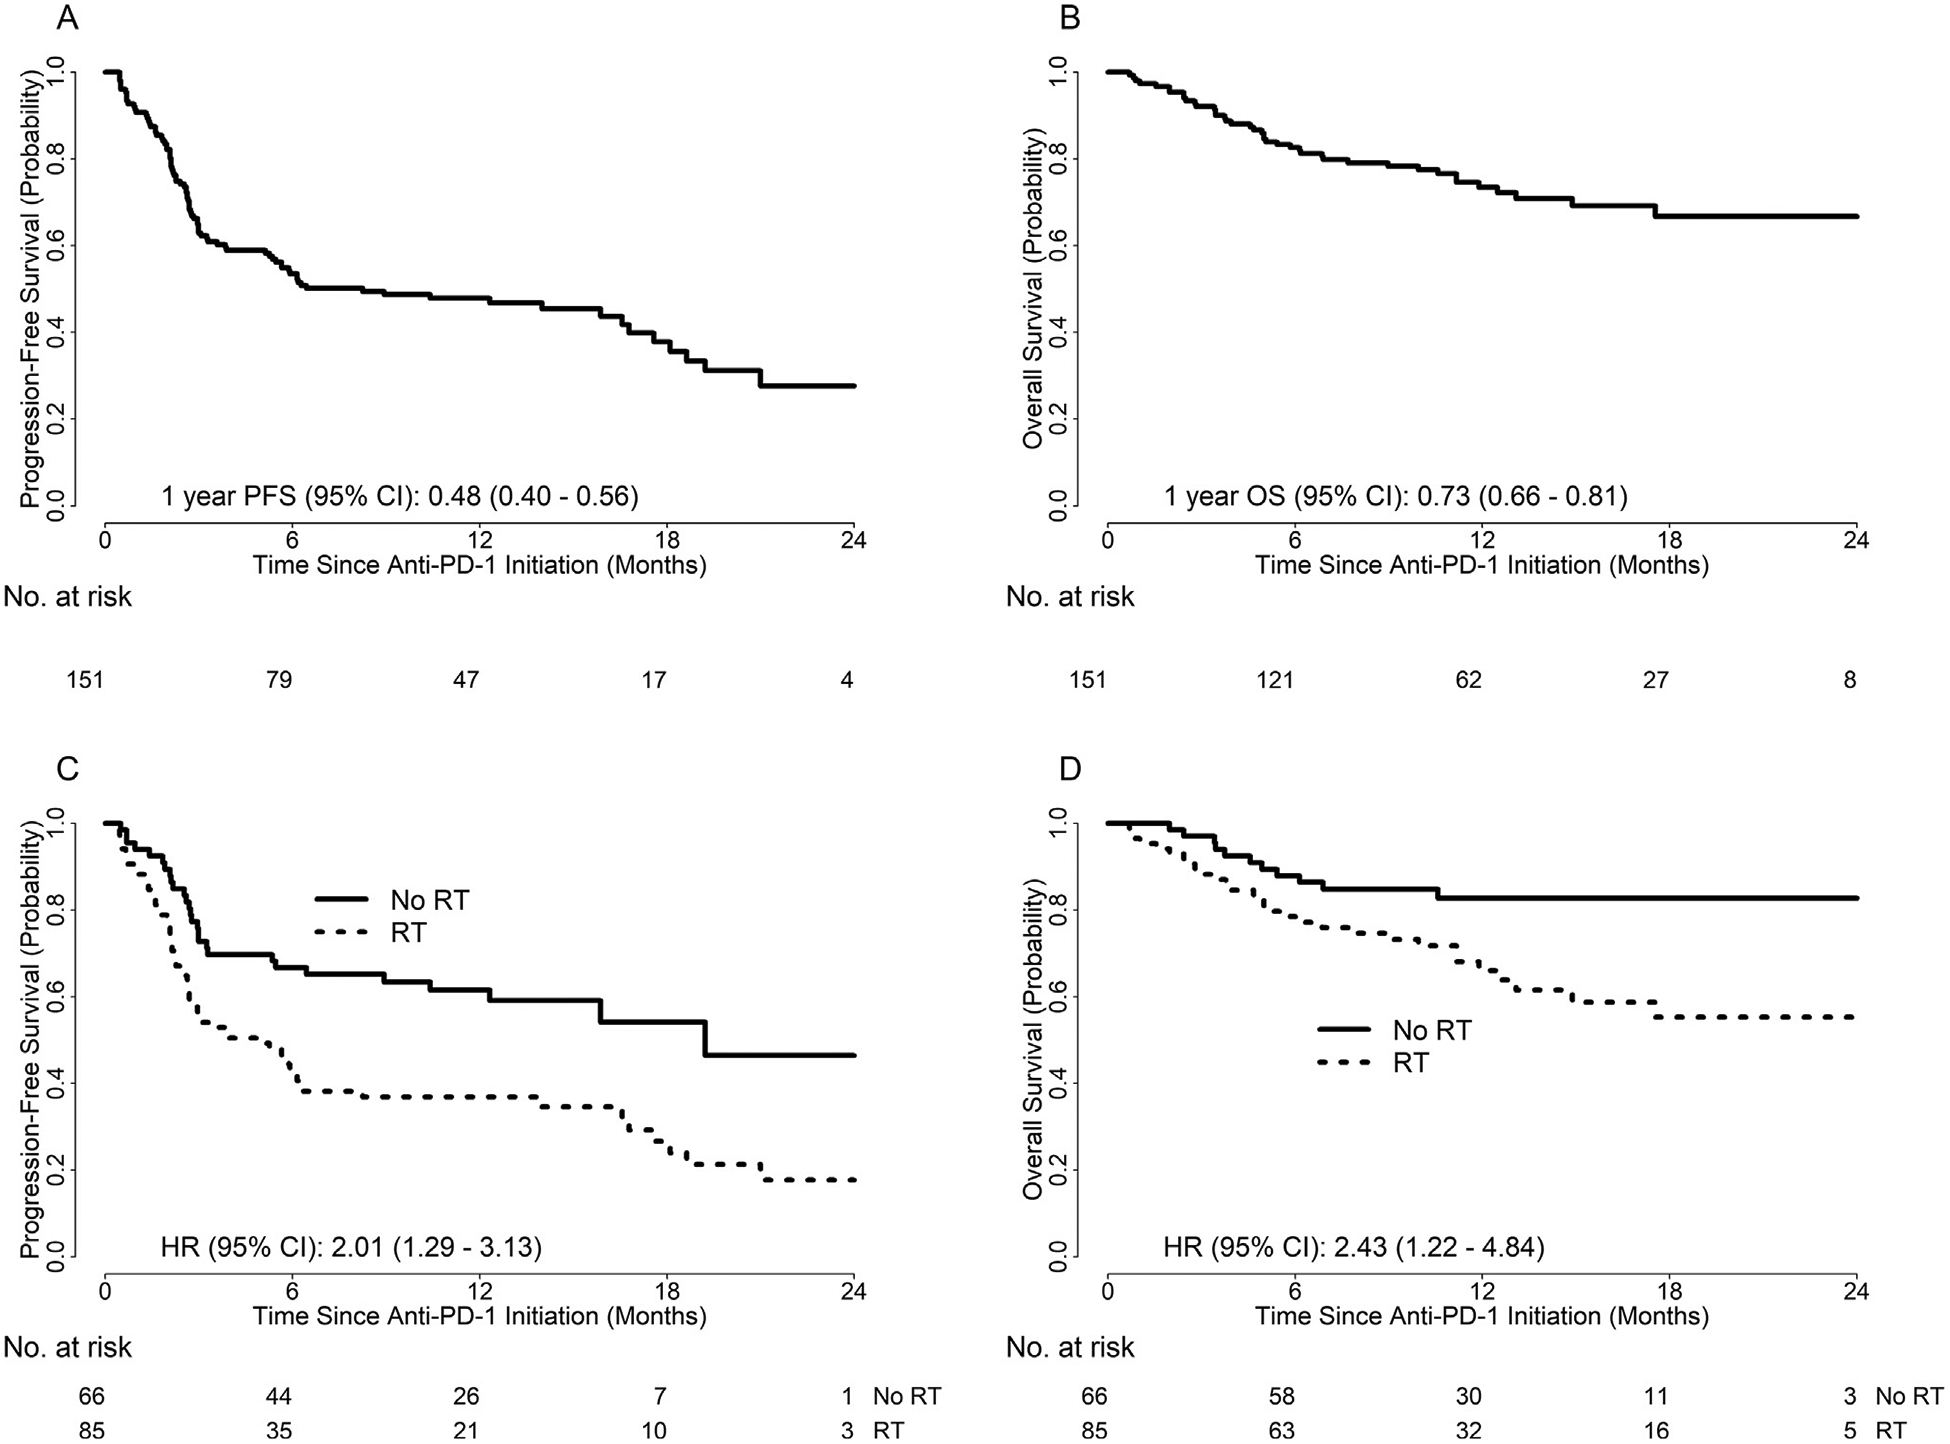
Kaplan–Meier’s curves illustrating (A) PFS of the entire cohort; (B) OS of the entire cohort; (C) PFS by receipt of RT; (D) OS by receipt of RT.
Official websites use .gov
A
.gov website belongs to an official
government organization in the United States.
Secure .gov websites use HTTPS
A lock (
) or https:// means you've safely
connected to the .gov website. Share sensitive
information only on official, secure websites.
Kaplan–Meier’s curves illustrating (A) PFS of the entire cohort; (B) OS of the entire cohort; (C) PFS by receipt of RT; (D) OS by receipt of RT.