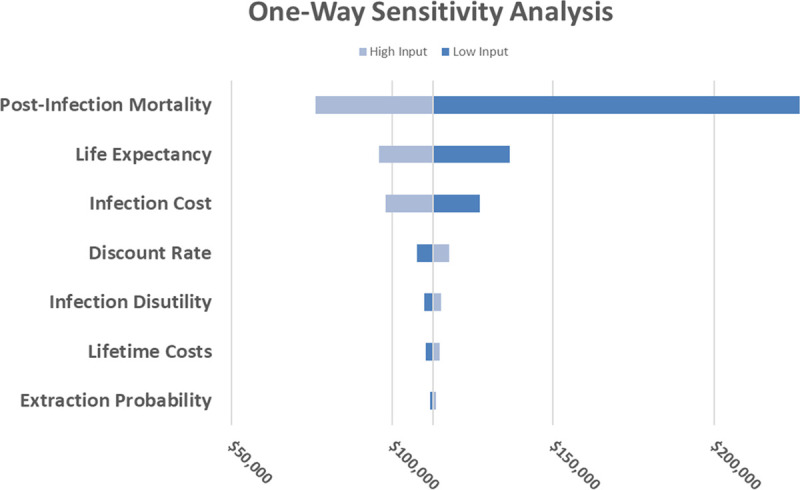
Figure 2.

One-way sensitivity analysis. Tornado chart of the range of incremental cost-effectiveness ratio (ICER) across high and low parameter input values (input values are available in Table V in the Data Supplement). Each input was varied with all others held constant. ICER values remained below the $150K willingness-to-pay (WTP) benchmark for the majority of input variations.
