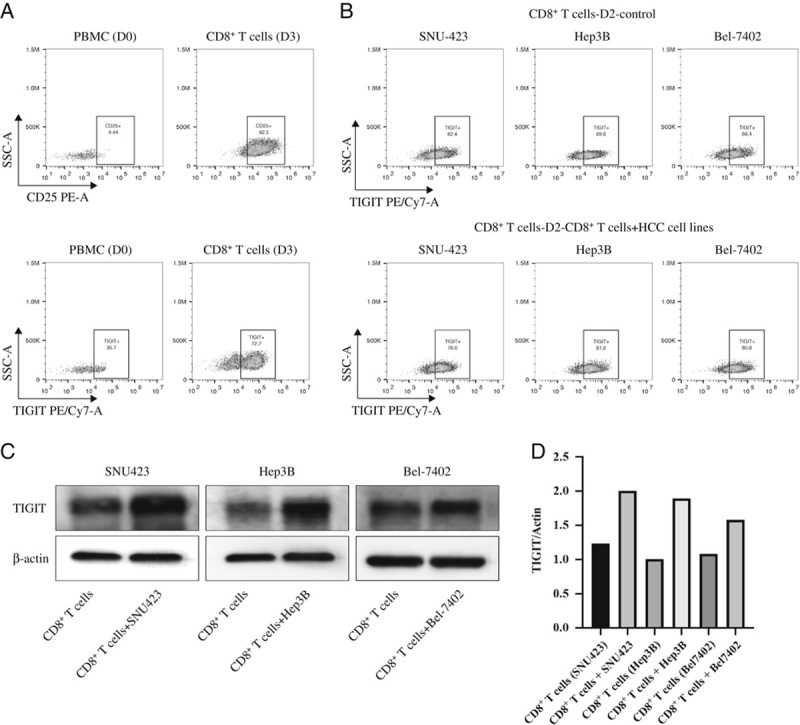
FIGURE 2.

A, Flow cytometry plots showing peripheral blood TIGIT+ CD8 T cells stimulated with αCD3/CD28 for 3 days. B, Flow cytometry plots showing TIGIT+ CD8+ T cells following 3-day αCD3/CD28 stimulation and 2-day coculture with SNU423, Hep3B, and Bel-7402 cells. C, Representative immunoblots showing TIGIT expression levels in the CD8+ T cells treated as above. D, The gray value of the target protein is divided by the gray value of the internal reference protein, and then normalized for comparison. PBMC indicates peripheral blood mononuclear cell; TIGIT, T-cell immunoglobulin and immunoreceptor tyrosine-based inhibitory motif domain.
