
Figure 3.
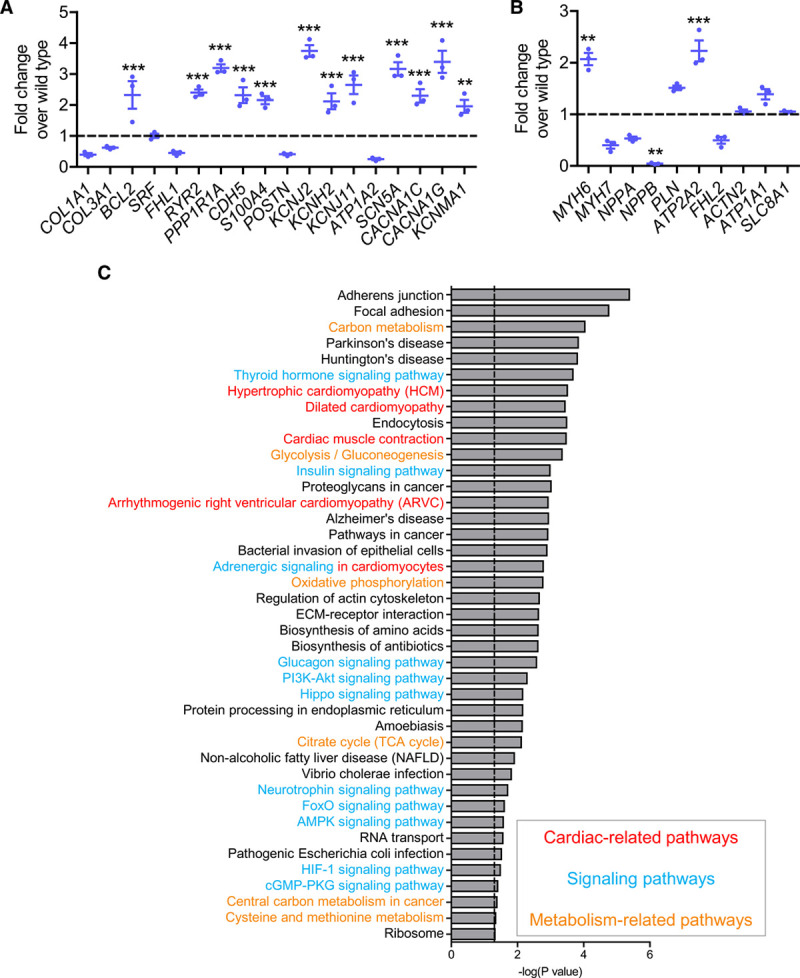
Gene expression changes in homozygous DNA methyltransferase(DNMT) 3A knockout engineered heart tissue(EHT).
Transcript abundance of (A) low-expression genes and (B) high-expression genes in DNMT3A−/− EHTs. All values normalized to wild-type (dashed line); n=3 per group, **P<0.001, ***P<0.001. C, Pathway mapping of significantly differentially expressed genes in DNMT3A−/− vs wild-type. Dotted line represents significance threshold of P<0.05. Red, cardiac-related; blue, signaling-related; yellow, metabolism-related pathways.