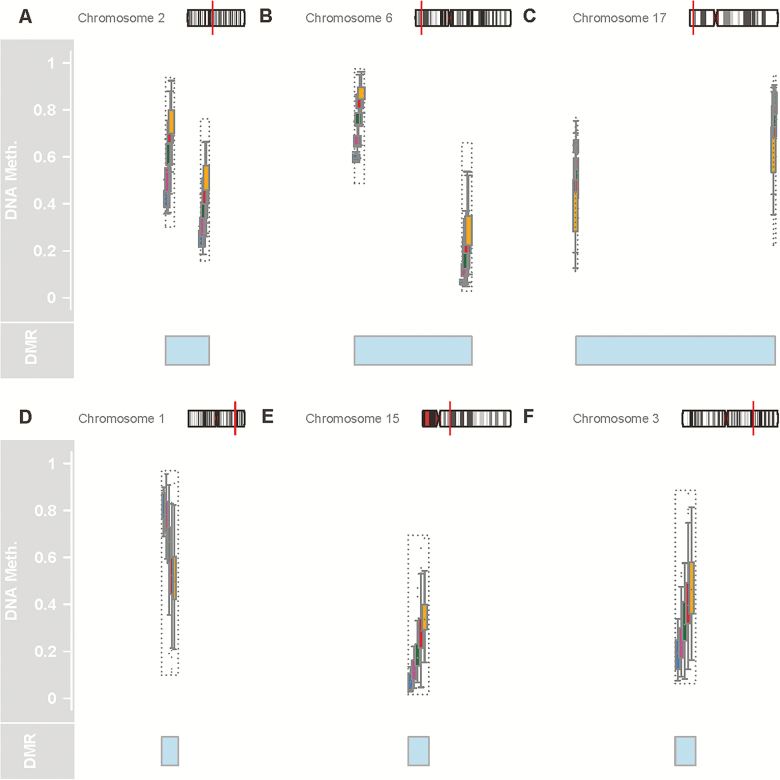
Figure 1.
Six age-associated differentially methylated regions (aDMRs) described in this study. Each panel shows, from top to bottom, the location of the aDMR within the chromosome; the normalized methylation data at each CpG along the aDMR; a highlight of the region considered the aDMR. The chromosomal location is represented in an ideogram showing the chromosome structure, in particular chromosome bands, with the aDMR location represented as a red line. Normalized methylation data at each CpG is shown with each box representing one age group as color-coded, with blue as ages 20–34, magenta as 35–49, green as 50–64, red as 65–79, and yellow for >80. The blue shaded region shows the region between the regulated CpGs, which we consider as a aDMR. In cases in which only one CpG is changing, the aDMR highlight marks only that CpG. In A, B, and C, two CpGs constitute the aDMR; in E, F, and G, one CpG represents the aDMR. For A, B, and C, the ends of the highlight denote the positions of the CpGs; for E, F, and G, the center of the highlight is position of the CpG.

