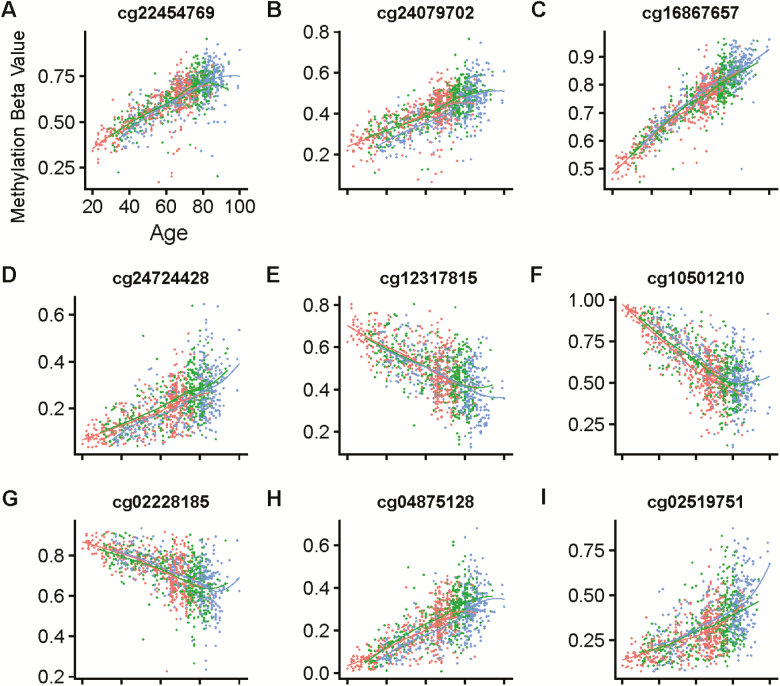
Figure 2.
The trajectories of the methylation levels (beta values) of all nine aDMR CpGs are plotted longitudinally, with each panel showing one CpG. Each dot represents one measure of CpG methylation, and dots are color-coded according to the timepoint, with red as timepoint 1 (time 0), green as timepoint 2 (time +9 years), and blue as timepoint 3 (time +15 years). Each line indicates a loess regression of each timepoint, to show batch effects. A–E: Each individual CpG considered.

