Fig. 3.
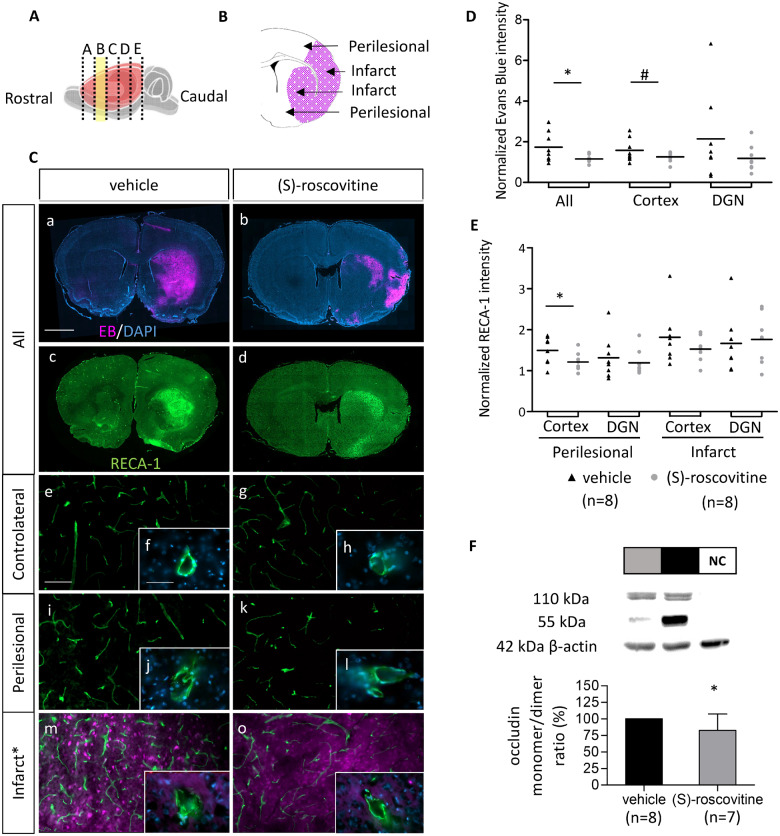
EB extravasation decrease is associated with RECA-1 signal inhibition and preservation of dimeric occludin form. (A) Rostro-caudal position of slice B, used for endothelial assessment. (B) Two analysed regions: cortex and DGN of ischaemic hemisphere called perilesional and infarct, respectively around and in the EB extravasation area (purple). EB emits at 680 nm, i.e., in red, however, to make the figures easier to interpret for colour blind readers, we converted red channel to purple (original red colour can be seen in Supplementary Fig. 3). (C) Immunohistofluorescent analysis of slice B of EB and endothelial cells on (S)-roscovitine (n = 8) and vehicle group (n = 8). EB extravasation fluorescence (a, b) was measured on the entire hemisphere, the cortex, and the DGN (D). Scale bars length is 2 mm. On the same section, endothelial cells were labelled with RECA-1 antibody (c, d). Intensity of RECA-1 was measured on Infarct and Perilesional region of cortex and DGN and normalized by contralateral RECA-1 intensity (E). Measurements were performed by blind operator. Morphological state of endothelial cell was observed on contralateral (e, f, g, h), perilesional (i, j, k, l) and infarct (m, n, o, p) regions of (S)-roscovitine and vehicle group at 20× (Scale bar length is 100 µm) and 63× (Scale bar length is 50 µm) magnification. Occludin concentration on the brain was measured on different animals treated with (S)-roscovitine (n = 7) or vehicle (n = 8) (F). Results are expressed as a ratio of monomer (55 kDa) and dimer conformation (110 kDa) of the protein, on ipsilateral ischaemic hemisphere. NC = negative control. Error bars expressed standard deviation. * P ≤ 0.05; #P ≤ 0.10.

