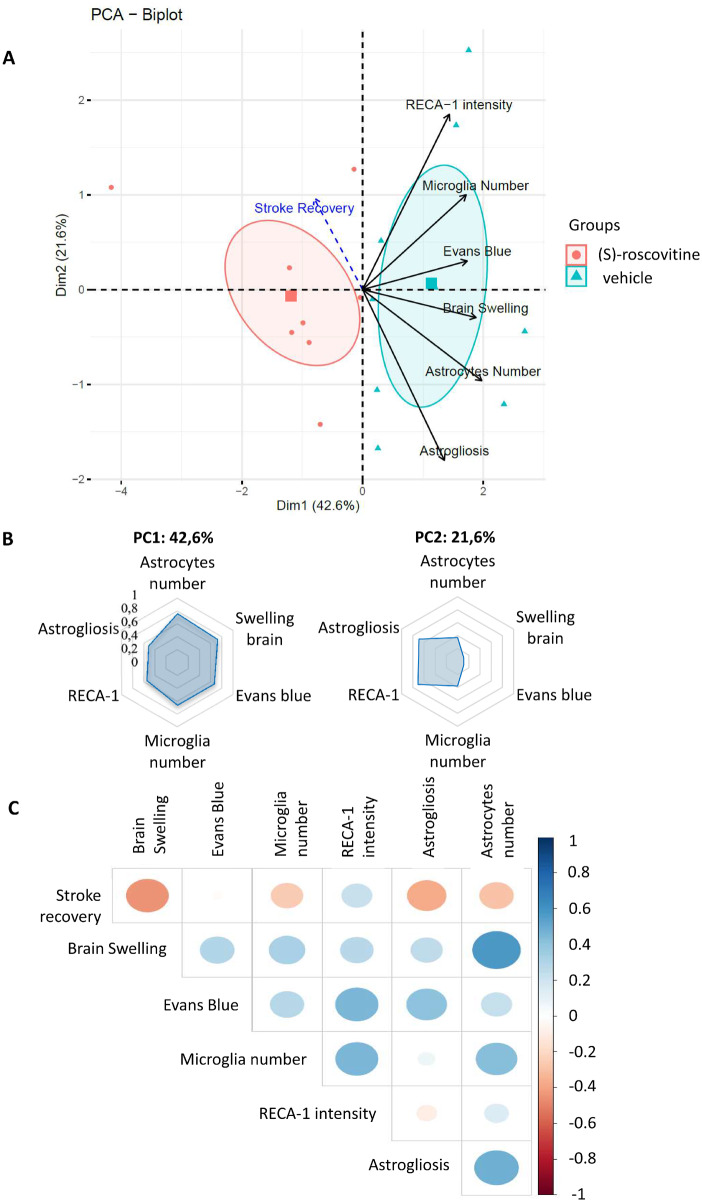
Fig. 6.
PCA. PCA of six variables measured on 16 individuals [vehicle n = 8; (S)-roscovitine n = 8]: oedema volume, EB extravasation intensity, endothelial cells activation (RECA-1 intensity), microglia and astrocytes number (cell/mm2) and astrogliosis (GFAP intensity/cell) (A). Recovery was projected on the model. An individual who is on the same side of a given variable has a high value for that variable. An individual who is on the opposite side of a given variable has a low value for that variable. PCA biplot: variance explained by PCA biplot is 64.2% (principal component 1: 42.6%; PC2: 21.6%). Barycentres (square symbols) representing the centre of masse of individuals of each group of rats, and their corresponding 95% confidence ellipse were also added on the PCA representation (B). Correlation of variables with dimension 1 (principal component 1) and dimension 2 (PC2) (C). Correlation matrix of variables: positive correlations are displayed in blue and negative correlations in red colour. Colour intensity and the size of the circle are proportional to the correlation coefficients.

