Fig. 3.
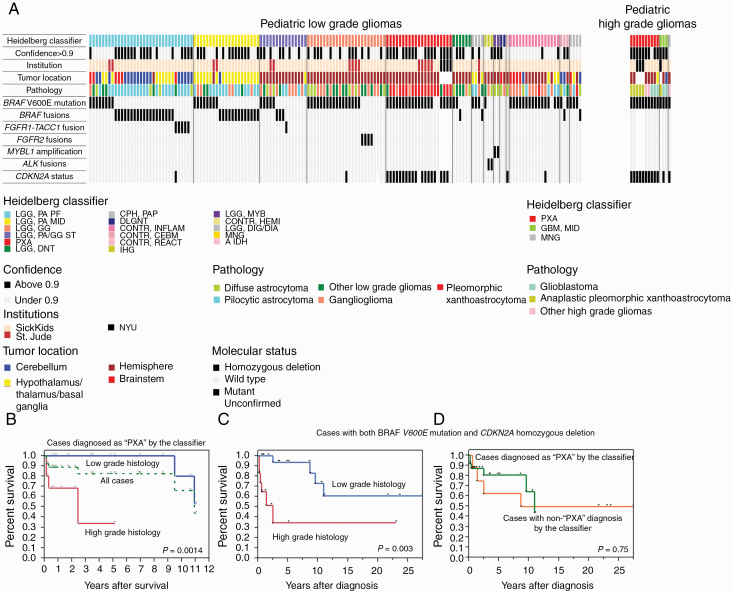
Epigenetic, clinical, and molecular features of study cohort. (A) Oncoprint of the cases. The Heidelberg classifier is indicated in the top column. The following information is indicated below the figure: confidence of the classifier showing the calibrated score more than 0.9 or not, Institution, tumor location, pathology, and molecular status, including BRAF V600E mutation, BRAF fusions, FGFR1-TACC1 fusion, FGFR2 fusions, MYBL1 alterations, ALK fusions, and CDKN2A status. (B) OS of the cases diagnosed as “PXA like” by the classifier. Green dot line indicates a survival curve of all of the cases. Red and blue lines are indicated survival curves depending on histological grade. (C) OS of pediatric gliomas with both BRAF-V600E mutation and CDKN2A homozygous deletion stratified by the histological grade. (D) Survival of the same cohort as stratified by the classifier.

