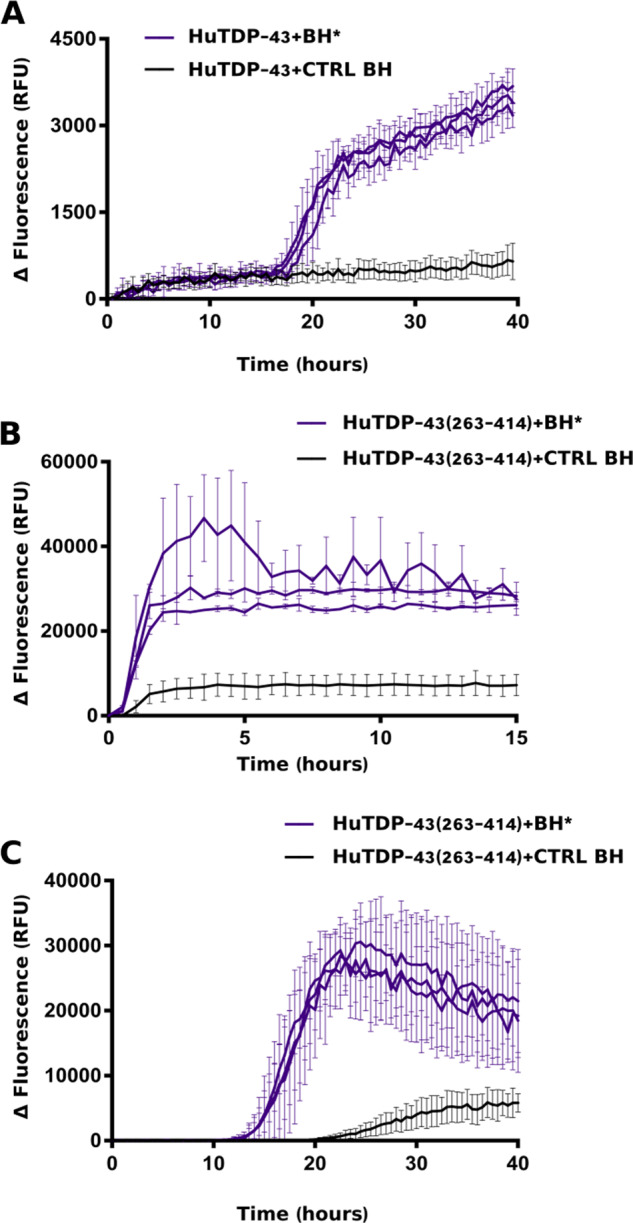
Figure 2.

RT-QuIC analysis of BH samples. In brief, 20 μL of sonicated and diluted (10−3) BHs collected from three FTLD-TDP patients (BH*, purple lines) and one CTRL patient (CTRL BH, black line) were added to purified seed-free recombinant HuTDP-43 (1 mg/mL) (A) and HuTDP-43(263-414) (0.2 mg/mL) (B) and analysed by means of RT-QuIC. The reaction was exposed to 60 s of shaking and 60 s of rest. All positive BHs efficiently seeded the reaction, whereas the negative control BH at the same dilution (10−3) did not affect the aggregation kinetics of the reaction. (C) Optimized protocol for BH analysis using purified seed-free HuTDP-43(263-414) (0.05 mg/mL) as substrate with a different reaction buffer (no NaCl, Gdn-HCl added) and a modified protocol (shaking at 100 rpm for 15 s every 30 min at 40°C). ThT fluorescence intensity was plotted against time. Each graph has a specific range of ThT fluorescence values and duration of a given reaction. The experiment was performed in triplicate and each replica was performed three times. Curves represent means for all experimental replicates and bars indicate the standard deviations (SD).
