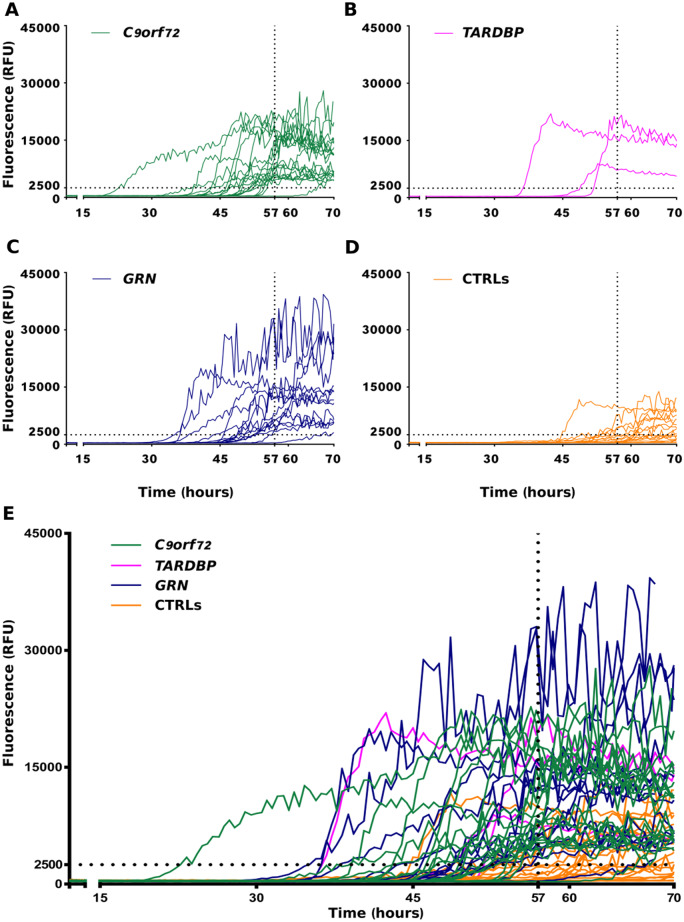
Figure 3.
RT-QuIC analysis of ALS and FTLD-TDP CSF samples. In brief, 6 μL of undiluted CSF collected from patients with a known pathological TDP-43-related mutation (C9orf72, green lines, TARDBP, magenta lines, GRN, blue lines) and from age-matched controls (CTRLs, orange lines) were added to purified seed-free recombinant HuTDP-43(263-414) (0.05 mg/mL) and analysed by means of RT-QuIC with the optimized protocol (shaking at 100 rpm for 15 s every 30 min at 40°C). ThT fluorescence intensity is plotted against time. Dotted black lines represent the ThT fluorescence and lag-phase thresholds. In the first four panels (A–D) the curves for each group are shown separately, whereas in (E) samples are shown all together. The experiment was performed in triplicate and each replica was performed three times. Each curve shows the median aggregation curve for each sample.

