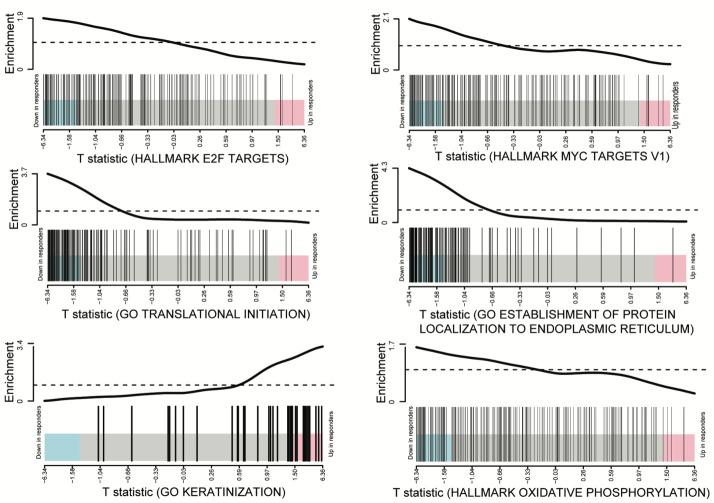
Figure 4.
Barcodeplots highlighting lower cellular growth markers in responders. Limma barcodeplots of the “E2F targets” and “MYC targets (V1)” gene sets from the MSigDB. There is a clear reduction in the expression of many of the genes in these gene sets in tumors that responded to immune checkpoint inhibitor, suggesting lower proliferation in these samples. Limma barcodeplots of the “GO translational initiation” and “GO establishment of protein localisation to the endoplasmic reticulum” gene sets from the MSigDB. These gene sets again highlight a signature of reduced proliferation in responders.

