Fig. 3.
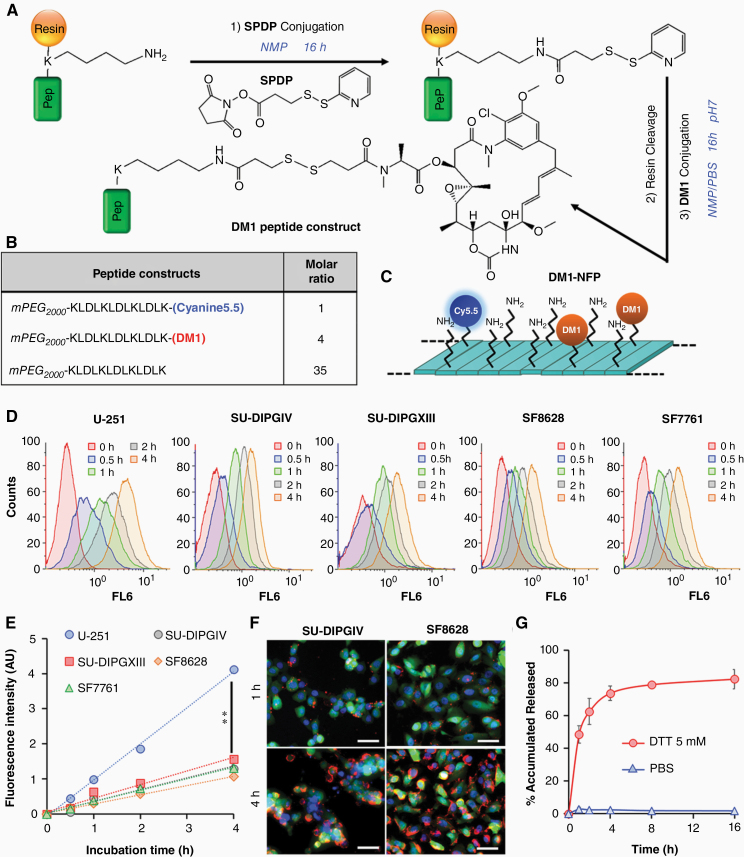
In vitro cytotoxicity of DM1-NFP. (A) Synthetic scheme of the DM1-conjugated peptide construct. (B) The composition of the DM1-NFP. (C) The nanofiber was coassembled from a mixture of Cyanine5.5-conjugated, DM1-conjugated, and naïve peptide constructs in a ratio of 1:4:35. (D) The cellular uptake of DM1-NFP in SU-DIPGIV, SU-DIPGXIII, U-251, SF8628, and SF7761 human brain cancer cell lines. FACS analysis showing the increase of the intracellular Cy5.5 fluorescence over time. Cells were treated with DM1-NFP (10 μM peptide content) for 0, 0.5, 1, 2, and 4 h prior to FACS analysis. (E) Plots of the kinetics of DM1-NFP cellular uptake by different glioma cell lines. (F) Fluorescence microscopic images showing the cellular uptake of DM1-NFP in glioma cells. Images were acquired 4 h after incubation of DM1-NFP (red, 10 μM peptide content) with GFP/Luc-transduced SU-DIPGIV and SF8628 cells (green). DAPI was added to the cells for staining the nuclei (blue) prior to imaging. Scale bar is 50 µm. (F) DM1-NFP released DM1 in the presence of DTT (5 mM). Plot showing the percentage of accumulated drug release from the nanofiber (10 μM) over time in PBS buffer. The drug release was determined by high-performance liquid chromatography (HPLC) analysis.

