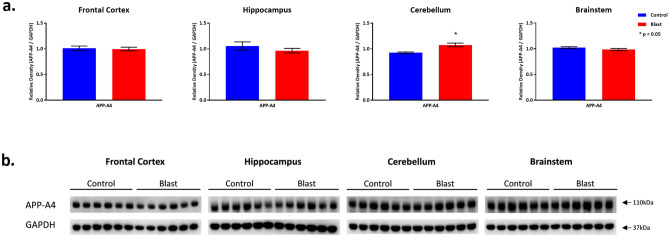
Figure 4.
APP-A4 protein expression following Double Blast Exposure. (a) Histograms representing the densitometric ratio of levels of APP-A4 with respect to GAPDH as measured in the frontal cortex, hippocampus, cerebellum and brainstem in the brains of rats 15-days after an explosive-driven double blast (24 h apart) exposure, n = 6 per group. * indicates p values < 0.05 as determined by 2-tailed, unpaired, t-tests. Error bars represent standard error of the mean (SEM). (b) Representative western blots* for antibodies used. *For full length blots for each antibody, see Supplementary Fig. S10–S13 online.

