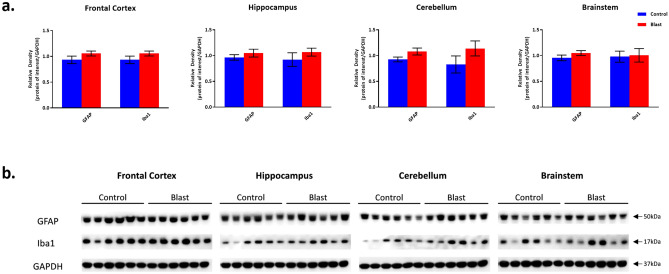
Figure 5.
GFAP and Iba1 protein expression following Double Blast Exposure. (a) Histograms representing the densitometric ratio of levels of GFAP and Iba1 with respect to GAPDH as measured in the frontal cortex, hippocampus, cerebellum and brainstem in the brains of rats 15-days after an explosive-driven double blast (24 h apart) exposure, n = 6 per group. Error bars represent standard error of the mean (SEM). (b) Representative western blots* for each antibody used. *For full length blots for each antibody, see Supplementary Fig. S10–S13 online.

