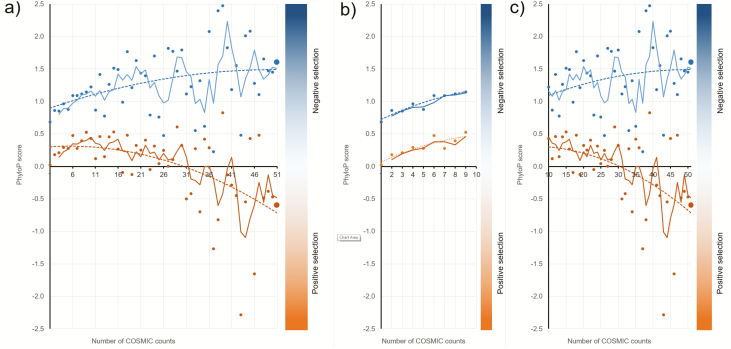
Figure 3.
PhyloP scores for somatic mutations stratified by the number of times they are reported in COSMIC. Somatic mutations not reported as SNPs (blue dots) and somatic mutations reported as SNPs (orange dots) were analyzed separately. Large dots show mean PhyloP scores for the somatic mutations reported >50 times in COSMIC. Dotted lines show polynomial regression and solid lines moving averages. (a) All count categories; (b) somatic mutations with 1–9 COSMIC counts; and (c) somatic mutations reported ten or more times in COSMIC.

