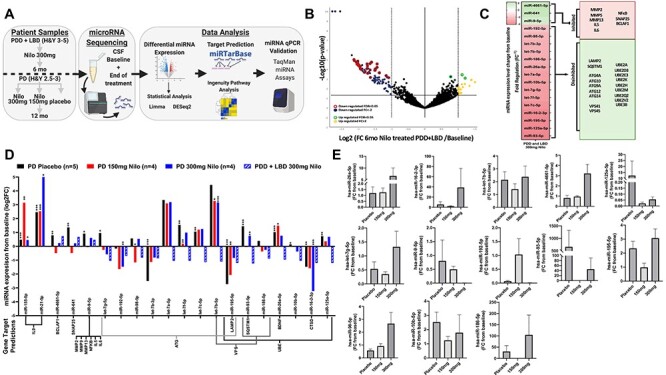
Figure 5.

Nilotinib alters miRNAs that regulate autophagy genes in the CSF of PDD, LBD and PD patients. (A) miRNAseq study design; (B) volcano plot of miRNA upregulated and downregulated from baseline in the CSF of five individuals with advanced PD with dementia and LBD (Hoehn and Yahr = 3–5) after 6 months Nilotinib treatment. miRNAs were analyzed using Qiagen Data Analysis Center and DESeq2 and Limma pipelines normalized and plotted as −log10 (P-value) (y-axis) versus log2 (fold-change 6 months Nilo-treated/baseline) (x-axis). Yellow and blue indicate fold change ≥ ± 2, red and green FDR; P < 0.05; Benjamini−Hochberg FDR multiple comparisons. (C) Heatmap (left) of average miRNA changes from baseline (Fig. 5B) as FR (equal to negative inverse of Fold-change (FC)). Predicted gene targets (right) of the significantly differentially expressed miRNA. Predicted target genes determined via human miRTarbase curated database and ingenuity pathway analysis filtered for highly predicted and experimentally observed. miRNAs in red indicate decreased expression and green indicate increased expression. Target genes in red indicate hypothesized inhibition of target mRNA by miRNA and green indicate hypothesized disinhibition of target mRNA. (C) miRNA changes from baseline in individuals with moderate PD (Hoehn and Yahr = 2.5–3) who received 150 (n = 3) or 300 mg (n = 4) nilotinib versus placebo (n = 6) for 1 year and PDD and LBD individuals. Quantification of miRNA expression plotted as log2 FC (y-axis) for each candidate miRNA (x-axis) including PDD and LBD (Fig. 5B and C). Predicted target genes are included below x-axis. *P < 0.05, **P < 0.01, ***P < 0.001; within-group change was analyzed using normalized paired differential genes expression testing via DESeq2 and Limma-based pipelines. (E) RT-qPCR of candidate miRNA in individuals with moderate PD (Hoehn and Yahr = 2.5–3) who received 150 (n = 3) or 300 mg (n = 4) nilotinib or placebo (n = 6) for 1 year using TaqMan advanced miRNA assays. For RT-qPCR, statistically significant change was obtained via ordinary one-way ANOVA with Tukey post hoc test.
